January 2024 Skyview Weather Monthly Newsletter
Feature Article
Snow Crystal Science – The Art and Physics of Colorado Snowflakes
Introduction
Colorado is best known for its snow-capped peaks and ski resorts. This makes snow and the formation of snowflakes one of the most important and interesting topics in the wintertime here in the Centennial State. Snowflakes can vary depending on many different physical characteristics in the atmosphere, which can determine the type of powder that a skier would experience on the slopes as well as on the roads.
Snowflake Formation
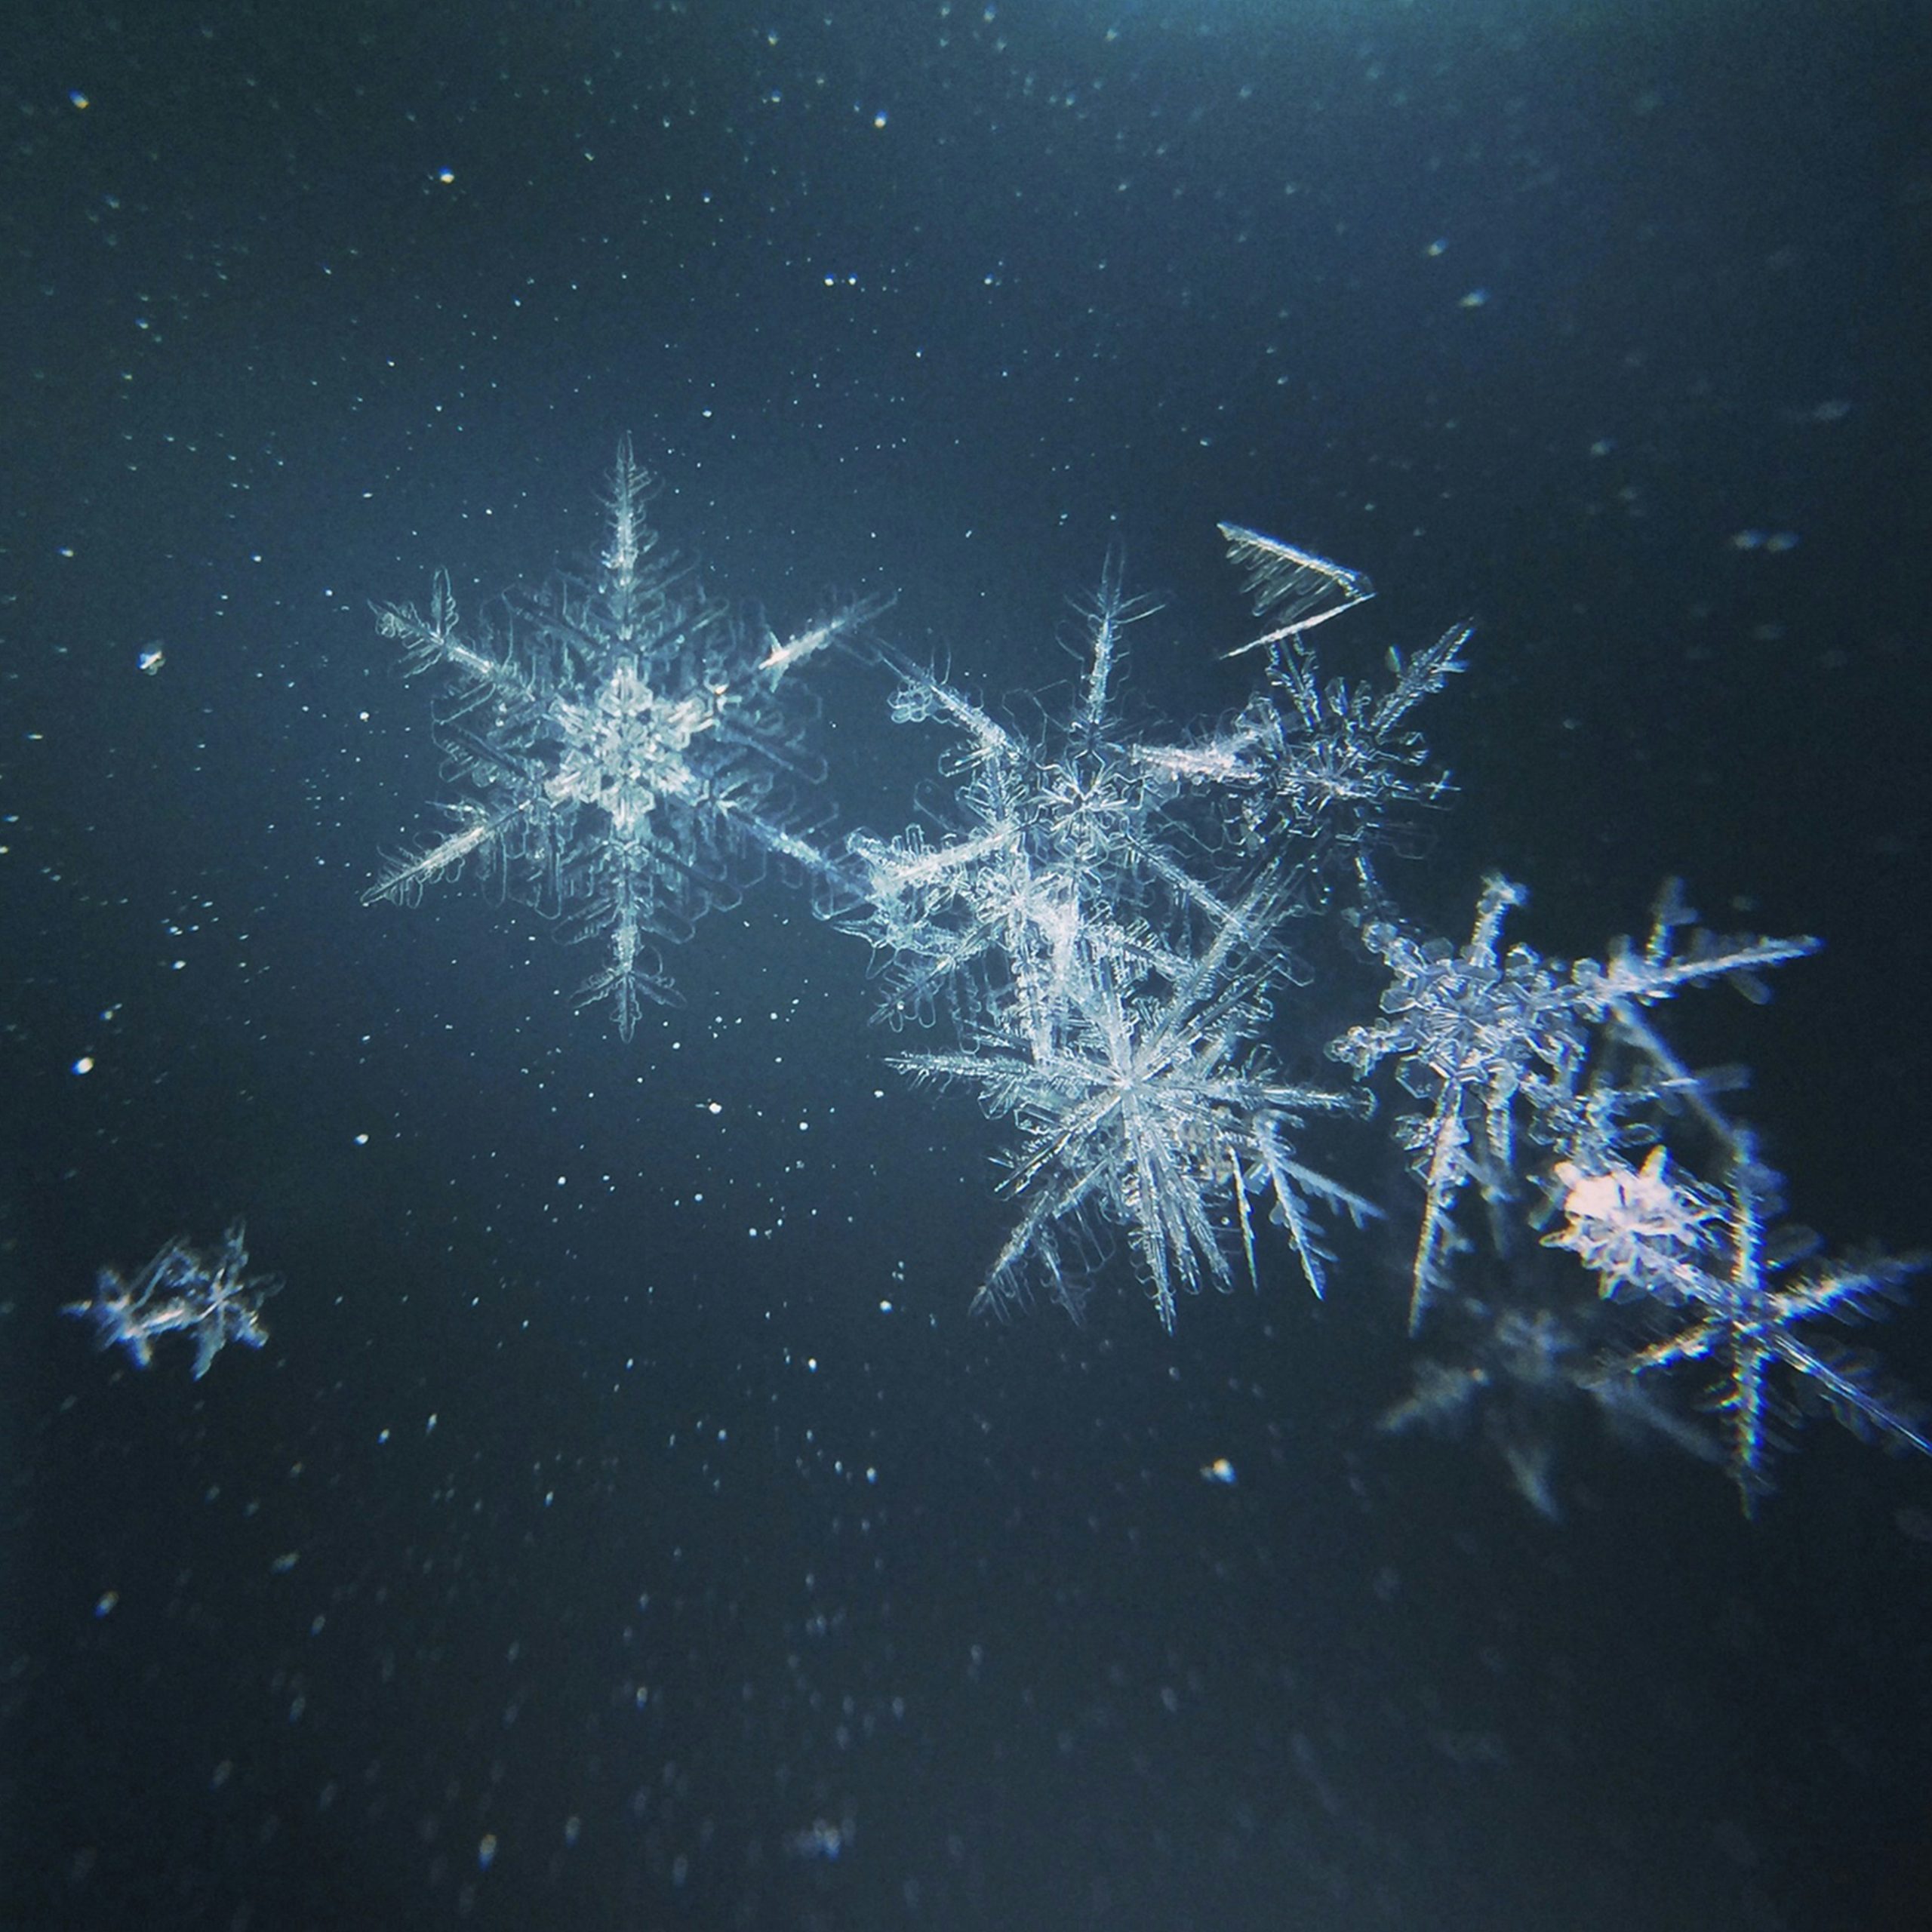
How do snowflakes form? Humidity and temperature are the most important factors when it comes to snowflake development. The life of a snowflake starts as a very cold water droplet that attaches itself by means of freezing to an ice nuclei such as pollen or dust. This starts the hexagonal ice particle that will eventually evolve as it falls through the atmosphere. The processes of facet formation and branch development are responsible for creating the iconic shape of a snowflake. No two snowflakes are the same, due to the varying atmospheric conditions at each stage.
Microscale Dynamics
While a snowflake falls it encounters many different physical nuances that change how it is shaped. Conditions such as varying temperatures, humidity, and different ice nuclei as well as the timing and order of these conditions can create an infinite amount of snowflake shapes. This is why no two snowflakes are the same.
Snow Crystal vs. Snowflake
Snowflakes are slightly different from snow crystals in that they are often used as an umbrella term for many different types of winter precipitation. This could include one snow crystal or a group that collide into each other resulting in larger flakes. Snow crystals on the other hand result from water vapor skipping the liquid phase and turning directly into ice.
Types of Snow Crystals
- Hoarfrost: Ice crystals deposited on surfaces below the frost point, directly transitioning from vapor to solid.
- Rime Frost: Formed when supercooled droplets freeze and attach onto exposed surfaces, often arising from freezing fog or mist droplets.
- Graupel: Rounded, opaque pellets formed as ice crystals fall through supercooled cloud droplets, distinct from hail with a softer, crumbly texture.
- Polycrystals: Snowflakes composed of numerous individual ice crystals.
Controlling Powder Type for Skiing
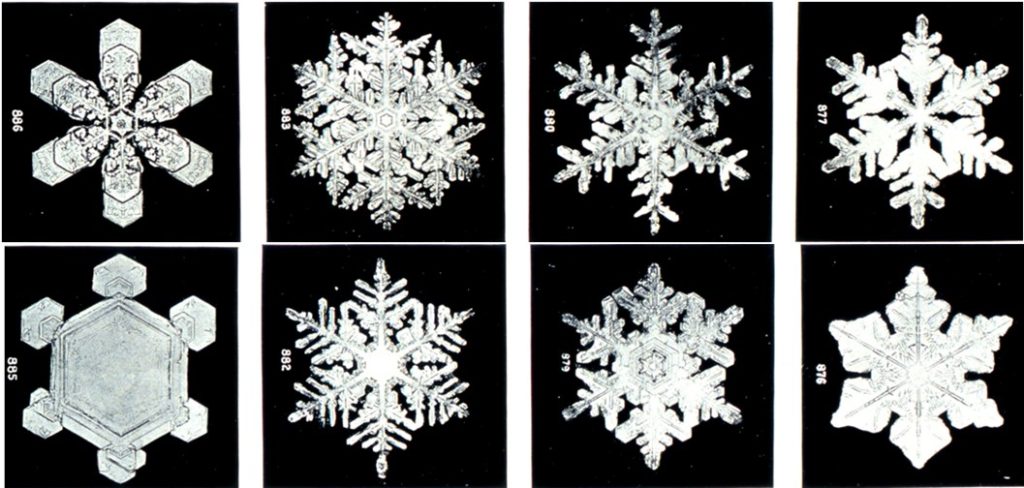
The type of powder that a skier or snowboarder would experience depends on the size and shape of the snowflakes. The lightest or “fluffiest” powder is typically created when larger snowflakes fall. These can vary in shape to form larger dendrites, sectored plates, or thin plates. These form when the moisture content is higher with colder temperatures.
Temperature and Moisture
Warmer temperatures between 26 and 32 degrees Fahrenheit, can create heavier snow flakes taking the shape of small dendrites and plates [Fig. 1]. Temperatures between 0 and 14 degrees Fahrenheit can create needle shapes and with more moisture, can create solid prism shapes. On the other hand, very cold temperatures between -6 to -31 degrees Fahrenheit can provide smaller columns and plates due to the lack of moisture.
Perfect Conditions for Blower Powder
The term “blower” powder is often used for the ideal type of snow for skiing and snowboarding. The snowflakes that are responsible for this type of powder typically form in the temperature range of 0 to 10 degrees Fahrenheit. Large dendrites form and begin to stack amongst and on top of each other, forming air pockets. These air pockets give the snow a “bouncy” quality and are ideal for snow sports.
The next time that you hit the slopes of the Colorado Rockies, take a look at the incredibly intricate snowflake patterns that have fallen. Colorado is rich in nature’s wonders and continues to amaze everyone who gets to experience its beauty.
January Drought Update
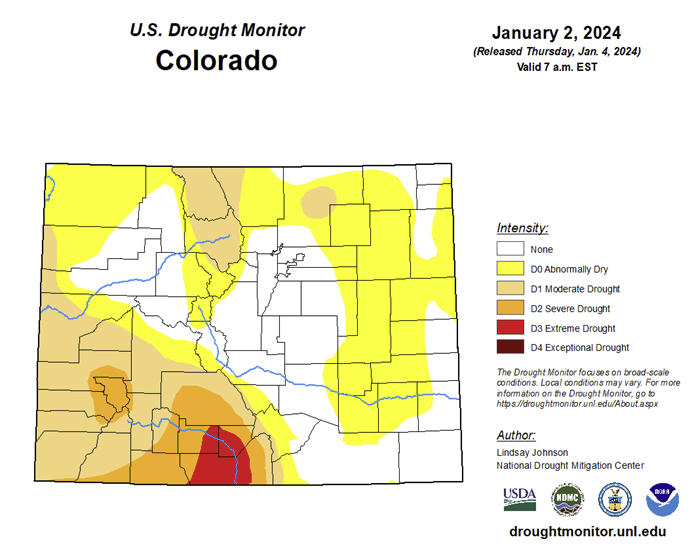
In January 2024, the western regions of Colorado experienced minimal changes in drought conditions. This is primarily due to the fact that the precipitation in these areas is predominantly in the form of snowfall, which will not alleviate drought conditions until the spring thaw. In contrast, northeastern Colorado, particularly Weld County, reported an increased drought severity over the last month, resulting from below-average precipitation during the month of December.
January 2024 Temperature Anomaly Forecast
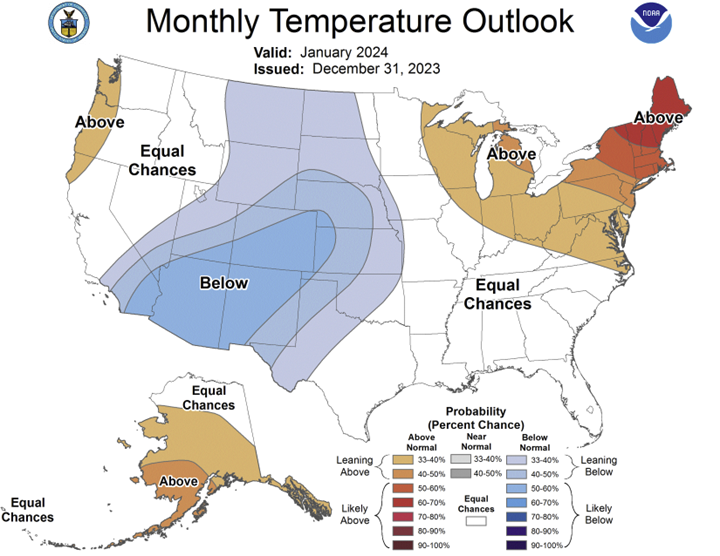
In January 2024, below-average temperatures are forecast for the United States. However, during the first week of the month, this projection has not been entirely accurate, as locations across the Western US have experienced above-average temperatures. Additional storm systems are anticipated to affect the region through mid-January, which could increase the likelihood of below-average temperatures overall.
January 2024 Precipitation Anomaly Forecast
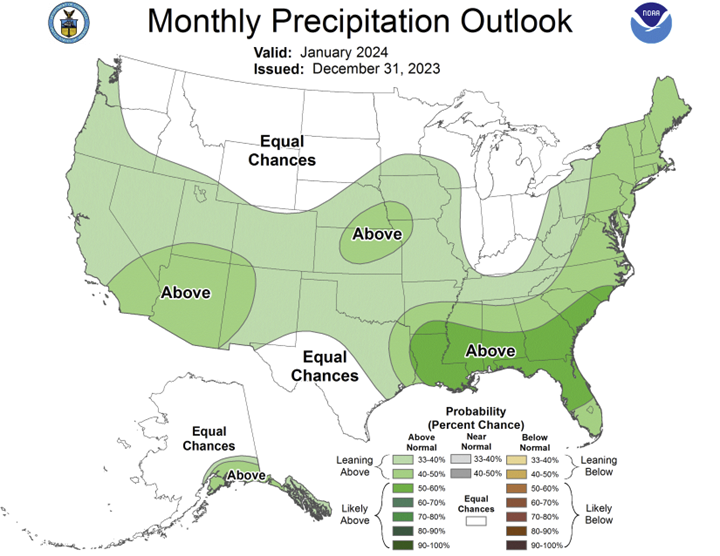
In January 2024, slightly above-average precipitation is anticipated for most of the US, with above average precipitation expected across the southeastern US. Average precipitation is expected across the Northern Plains and Great Lakes regions.
Colorado December Weather Summary
In December 2023, the Denver metropolitan area experienced temperatures significantly above average, with some regions reporting below-average precipitation. Denver International Airport (DIA) reported an average daily high temperature of 50.5°F and a daily average low temperature of 24.3°F. The combined average temperature was 37.4°F, which is 6.2°F higher than the typical monthly average of 31.2°F. The highest temperature, 71°F, was recorded on December 6th, while the lowest temperature, 8°F, was observed on December 25th.
In terms of precipitation, DIA reported 0.12” of liquid precipitation, which is 0.23” below the December average of 0.35”. Throughout December, DIA did not experience several storms that affected other areas in the Denver Metro. Only two storm systems had a significant impact on DIA in December, occurring on the 8th (0.4” of snow accumulation) and the 13th (1.0” of snow accumulation), accounting for the total snowfall at DIA during the month of December. However, the winter storm on December 8th resulted in a wide range of snowfall accumulation; 1.0-4.0” across the Denver Metro area, with minimal amounts observed at DIA. An additional storm from December 26th through December 27th brought heavy snow to parts of Arapahoe County, with areas along the I-225 corridor receiving between 6.0-8.0” of snow accumulation, while DIA reported only a trace from that same storm.
In southeastern Colorado, December 2023 also recorded above average temperatures and precipitation. The Colorado Springs airport recorded an average daily high temperature of 50.2°F and an average daily low temperature of 24.6°F. The combined monthly average was 37.4°F, or 5.7°F above the typical monthly average of 31.7°F. In terms of precipitation, the Colorado Springs airport reported 0.57” of liquid precipitation, 0.34” above the December average of 0.23”. The majority of this precipitation fell on December 13th, with 0.29” recorded during that 24-hour period.
Pueblo experienced similar weather conditions in December, with above-average temperatures and precipitation. Pueblo recorded an average daily high temperature of 51.1°F and an average daily low temperature of 20.6°F. The combined monthly average was 35.9°F, or 4.2°F above the typical monthly average of 31.7°F. The warmest day was December 6th, when the Pueblo airport recorded a temperature of 77°F, setting the daily high temperature record. The coldest day was on December 10th, when a temperature of 6°F was recorded. Precipitation in Pueblo was above average throughout the month, with 1.31” of liquid precipitation recorded, an impressive 1.02” above the December average of 0.29”. Most of this precipitation occurred on December 23rd, when a record-breaking 0.57” fell during a 24-hour period. This resulted in the 2nd wettest month on record for the Pueblo area, however, it was only the 23rd snowiest month as most precipitation fell as rainfall rather than snow.
Weather Statistics for Denver International Airport, December 2023
DIA December 2023 Temperature (°F)
| Observed Value | Normal Value | Departure From Normal | |
| Average Max | 50.5°F | 44.0°F | 6.5°F |
| Average Min | 24.3°F | 18.4°F | 5.9°F |
| Monthly Mean | 37.4°F | 31.2°F | 6.2°F |
| Days With Max 90 Or Above | 0 | 0 | 0 |
| Days With Max 32 Or Below | 2 | 6.4 | -4.4 |
| Days With Min 32 Or Below | 28 | 29.2 | -1.2 |
| Days With Min 0 Or Below | 0 | 1.9 | -1.9 |
DIA December 2023 Liquid Precipitation (Inches)
| Observed Value | Date(S) | Normal Value | Departure From Normal | |
| Monthly Total | 0.12” | 0.35” | -0.23” | |
| Yearly Total | 18.94” | 14.48” | -4.46” | |
| Greatest In 24 Hours | 0.07” | 12/13 | ||
| Days With Measurable Precip. | 3 | 4.4 | -1.4 |
DIA December 2023 Snowfall Accumulation (Inches)
| Observed Value | Date(S) | Normal Value | Departure From Normal | |
| Monthly Total | 2.2” | 6.6” | -4.4” | |
| Seasonal Total | 12.6” | 12.1” | -0.5” | |
| Greatest In 24 Hours | 1.0” | 12/13 | ||
| Greatest Depth | 1.0” |
January 2024 Preview
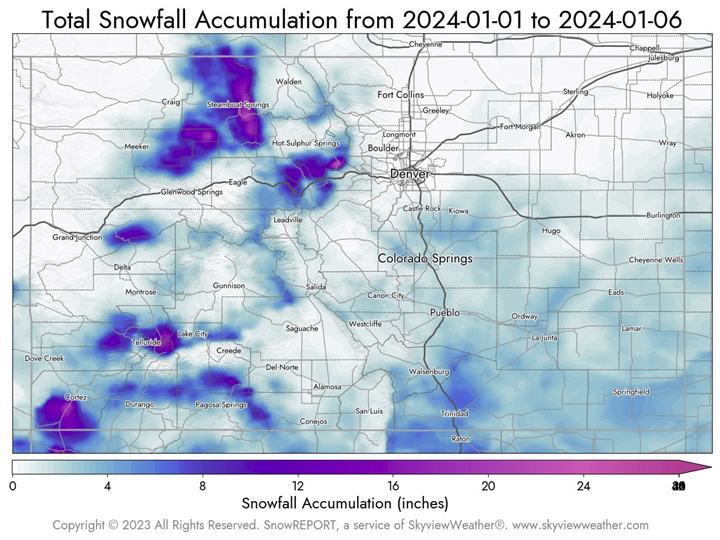
So far, the first week of January has been quiet across the Denver Metro, with a few inches of snowfall across the Palmer Divide and portions of southeastern Colorado. Portions of the Rockies, such as the Park Range, have received around two feet of powder since the new year.
In the second week of January 2024, meteorological models predict the advent of additional storm systems that are likely to affect the Denver Metropolitan area and southeastern regions of Colorado. These storm systems are anticipated to augment the cumulative snowfall across various parts of the state, with a particular emphasis on the northeastern regions where snowfall has been minimal thus far.
As of the current date, Denver International Airport (DIA) has not reported any precipitation. Should this trend persist, the precipitation levels at DIA would be significantly lower compared to previous years with higher precipitation. For comparative analysis, a list of the top ten snowiest January’s and the least snowy January’s recorded for Denver is provided below.
Denver’s Top 10 Snowiest January’s:
| Year | Snowfall |
| 1992 | 24.3 |
| 1949 | 22.2 |
| 1883 | 20.5 |
| 1948 | 19.2 |
| 1959 | 17.4 |
| 1962 | 17.2 |
| 1987 | 17 |
| 1891 | 17 |
| 2007 | 15.9 |
| 1951 | 15.7 |
Denver’s Top 10 Snowiest January’s:
| Year | Snowfall |
| 2003 | T |
| 1934 | T |
| 1931 | 0.1 |
| 1933 | 0.2 |
| 1952 | 0.3 |
| 1914 | 0.4 |
| 1935 | 0.8 |
| 1970 | 0.9 |
| 1961 | 1 |
| 1893 | 1 |
January Climatology for Denver
(Normal Period 1991-2020 DIA Data)
| Temperature | Observed Value |
| Average High | 44.6°F |
| Average Low | 18.7°F |
| Monthly Mean | 31.7°F |
| Days With High 90 Or Above | 0 |
| Days With High 32 Or Below | 5 |
| Days With Low 32 Or Below | 29 |
| Days With Lows Zero Or Below | 2 |
| Precipitation | Observed Value |
| Monthly Mean | 0.38” |
| Days With Measurable Precipitation | 4.4 |
| Average Snowfall In Inches | 6.4” |
| Days With 1.0 Inch Of Snow Or More | 2 |
| Miscellaneous Averages | |
| Heating Degree Days | 1034 |
| Cooling Degree Days | 0 |
| Wind Speed (Mph) | 8.6 Mph |
| Wind Direction | South |
| Days With Thunderstorms | 0 |
| Days With Dense Fog | 1 |
| Percent Of Sunshine Possible | 71% |
| Extremes | |
| Record High | 76.0°F On 1/27/1888 |
| Record Low | -29.0°F On 1/9/1875 |
| Warmest | 40.3°F In 1986 |
| Coldest | 16.9°F In 1930 |
| Wettest | 2.35” In 1883 |
| Driest | 0.01” In 1933 |
| Snowiest | 24.3” In 1992 |
| Least Snowy | Tr In 2003/1994 |
Winter 2023/2024 Snowfall Accumulation for the Colorado Eastern Plains
| City | Oct | Nov | Dec | Jan | Feb | Mar | Apr | Total |
| Aurora | 6.6 | 2.3 | 10.4 | 19.3 | ||||
| Boulder | 5 | 7.8 | 9.2 | 22 | ||||
| Brighton | 4.7 | 4 | 1.1 | 9.8 | ||||
| Broomfield | 4.3 | 5.3 | 3.2 | 12.8 | ||||
| Castle Rock | 9 | 2.1 | 9.7 | 20.8 | ||||
| Colorado Springs Airport | 0 | 1.1 | 8.4 | 9.5 | ||||
| Denver DIA | 7.5 | 2.9 | 1.4 | 11.8 | ||||
| Denver Downtown | 5.3 | 2.1 | 6.2 | 13.6 | ||||
| Golden | 10.7 | 14 | 14.6 | 39.3 | ||||
| Fort Collins | 5.7 | 9.6 | 0 | 15.3 | ||||
| Highlands Ranch | 5.8 | 1.8 | 6.9 | 14.5 | ||||
| Lakewood | 8.6 | 4.1 | 11.3 | 24 | ||||
| Littleton | 10 | 1.6 | 6 | 17.6 | ||||
| Monument | 6.5 | 1.5 | 14.8 | 22.8 | ||||
| Parker | 7.4 | 1 | 8.8 | 17.2 | ||||
| Sedalia – Hwy 67 | 10.5 | 3.3 | 9.4 | 23.2 | ||||
| Thornton | 4 | 4.4 | 4.4 | 12.8 | ||||
| Westminster | 5.1 | 4.7 | 5.3 | 15.1 | ||||
| Wheat Ridge | 6 | 3.4 | 6.9 | 16.3 | ||||
| Windsor | 3.5 | 5.5 | TR | 9 |