
March 2024 Skyview Weather Monthly Newsletter
Feature Article
Weather Satellites – NOAA’s GOES-R Series
Introduction
Meteorologists rely on an extensive array of advanced tools to interpret weather patterns and produce accurate forecasts, with satellite imagery playing a pivotal role. In the United States, the imagery obtained from NOAA’s Geostationary Operational Environmental Satellites (GOES)-18 Satellite, a cornerstone of the GOES-R Series, stands as a testament to cutting-edge technology in weather observation and environmental monitoring. Described by NOAA as “the Western Hemisphere’s most sophisticated weather observing and environmental monitoring system,” the GOES-R Series offers an unparalleled suite of capabilities, including advanced imagery, precise atmospheric measurements, real-time mapping of lightning activity, and vigilant space weather monitoring.
Geostationary Satellites
Satellites operate within distinct orbits, each serving a specific purpose in observation. Positioned approximately 22,236 miles above the equator, satellites in Geostationary Orbit maintain synchronicity with Earth’s rotation, affording continuous surveillance over a fixed geographic area. This characteristic makes them indispensable for monitoring rapidly evolving weather systems and providing timely updates to meteorologists and the public alike.
GOES Series
Launched in 2016, the inaugural satellite of the GOES-R series commenced operations as the GOES-East satellite, facilitating comprehensive monitoring of weather phenomena across the eastern United States and the Atlantic Ocean. Subsequent launches bolstered the series, with GOES-S deployed in 2018 to serve as a reliable backup and complement the primary satellite’s efforts. In 2022, the launch of GOES-T expanded coverage to the western United States and the Pacific Ocean, enhancing the nation’s resilience to weather-related hazards.
The naming convention of the GOES-R Series reflects a transition from pre-launch designations (GOES-R, GOES-S, GOES-T) to operational monikers (GOES-16, GOES-17, GOES-18) upon achieving Geostationary Orbit. This protocol ensures consistency and clarity in satellite identification throughout their operational lifespan.
The Latest GOES
The latest addition and last to launch in the GOES-R Series, GOES-U, embodies the culmination of technological innovation and operational excellence. Set to assume the role of GOES-19 upon deployment, GOES-U promises to perpetuate the legacy of its predecessors while introducing enhancements to further elevate weather observation capabilities. Notably, GOES-U embarked on its journey to launch on January 22, 2024, departing from Lockheed Martin’s facility in Littleton, CO, bound for the Kennedy Space Center in Florida. The GOES-U has and continues to undergo a series of tests, ensuring its resilience to the rigors of space and readiness for deployment. It is set to launch no earlier than April 30th, 2024, aboard one of the SpaceX Falcon Heavy rockets.

Looking ahead after GOES-U, NOAA and NASA are poised to usher in the era of Geostationary Extended Observations (GeoXO), representing the next frontier in weather satellite technology. GeoXO’s advanced instrumentation will revolutionize atmospheric, weather, and oceanic observations, offering unprecedented insights into environmental dynamics and enhancing forecasting capabilities. With GeoXO on the horizon, the future of meteorology is imbued with promise and potential, poised to tackle the challenges of tomorrow with unprecedented precision and foresight.
March Drought Update
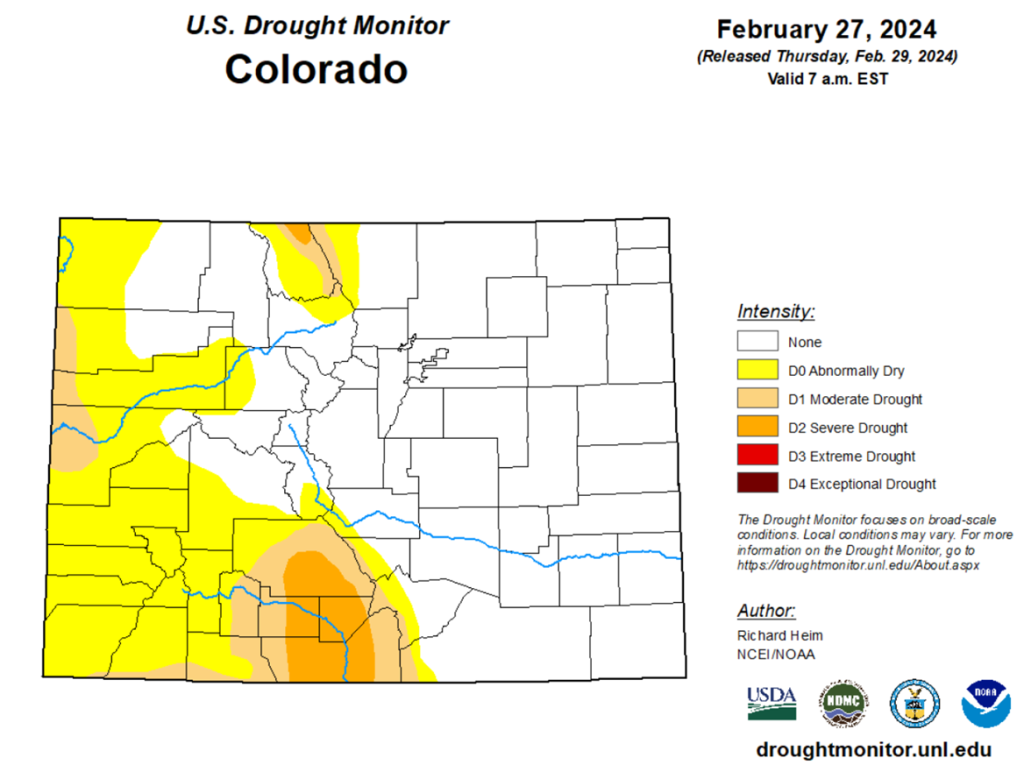
In the month of February 2024, the state of Colorado has witnessed substantial alterations in its drought conditions. Drought regions previously identified across the plains have now been completely mitigated. Concurrently, the western mountainous regions of the state, especially the San Luis Valley, have experienced a significant reduction in their drought severity. This transformation can be attributed to a series of snowstorms that transpired throughout February. These meteorological events were characterized by elevated moisture content, which has effectively contributed to the alleviation of the prevailing drought conditions across the state. This report underscores the dynamic nature of climatic conditions and their profound impact on the state’s hydrological balance.
March 2024 Temperature Anomaly Forecast
In light of a springtime shift in the jet stream, the temperature forecast for March 2024 presents a diverse thermal landscape across the United States.
The Intermountain West and Pacific Northwest regions are anticipated to experience temperatures that align with the seasonal norms. In contrast, the Desert Southwest is projected to encounter temperatures that fall below the typical range for this time of year.
On the other hand, the eastern United States, the Great Lakes Region, and the Northern Plains are likely to witness temperatures exceeding their usual levels. This forecast underscores the complex interplay of atmospheric dynamics and their influence on regional temperature patterns.
.
March 2024 Precipitation Anomaly Forecast
The precipitation forecast for March 2024 anticipates an above-average rainfall across specific regions of the western United States, including California, the Great Basin, and the Rockies. As of the initial week of March, the recorded precipitation levels have remained within the standard range for this period, not approaching any historical records. However, it is crucial to note that these conditions are subject to change in the subsequent weeks as winter weather systems develop over the Northern Pacific Ocean and advance east across the US. March is traditionally the month with the highest snowfall in the Rockies, suggesting the potential for high-precipitation systems to impact the region towards the month’s end.
Furthermore, the southeastern region of the United States may also experience above-average precipitation. This is attributed to the positioning of the subtropical jet stream during the spring season. The jet stream, a relatively narrow band of strong wind in the upper levels of the atmosphere, typically shifts pole-ward as the Sun’s elevation increases each day in the spring. This movement influences weather patterns and contributes to changes in seasonal precipitation amounts.
Colorado February Weather Summary
The meteorological summary for Colorado in February 2024 reveals a pattern of above-average temperatures and precipitation, particularly in the Denver metropolitan area. Denver International Airport (DIA) reported an average daily high temperature of 50.6°F and a daily average low of 24.6°F, culminating in a combined average of 37.6°F. This figure is 4.9°F higher than the typical monthly average of 32.7°F. The highest temperature, 66°F, was recorded on both February 20th and 31st, while the lowest temperature, 7°F, was observed on February 17th.
Boulder Airport reported an average high temperature of 49.6°F and an average low temperature of 28.8°F, resulting in an overall average temperature of 39.2°F. Similarly, Colorado Springs Airport recorded an average daily high temperature of 51.1°F and an average daily low of 26.3°F, yielding a monthly average of 38.7°F, which is 5.3°F above the standard monthly average of 31.9°F. The highest temperature, 67°F, was recorded on February 20th, while the lowest temperature, 13°F, was observed on February 11th.
Pueblo reported an average daily high temperature of 55.5°F and an average daily low of 24.3°F. The highest temperatures, 72°F, were recorded on February 25th and 26th, while the lowest temperature, 11°F, was observed on February 28th.
In terms of precipitation, DIA reported 1.46” of liquid precipitation, which is 1.05” above the February average of 0.41”. Colorado Springs Airport reported 1.37” of liquid precipitation, 1.05” above the February average of 0.32”. The majority of this precipitation occurred on February 3rd, with 0.55” of liquid precipitation recorded. Pueblo also experienced above-average precipitation, with 1.48” of liquid precipitation recorded, 1.16” above the February average of 0.32”. The majority of this precipitation occurred on the 3rd, with 1.06” recorded within a 24-hour period.
Throughout February, several storm systems impacted DIA, with five storms reporting more than a trace of snowfall. These events occurred on the 2nd-3rd (5.5”), 9th-10th (3.7”), 15th-16th (0.1”), 16th-17th (2.4”), and the 27th (2.0”), accounting for the total snowfall at DIA for the month. However, the 2nd-3rd storm resulted in higher snow totals for the metro region compared to DIA, with totals of 7.0”-16.0” reported south and west of the Denver Metro area, and some areas experiencing up to 19.5”. This disparity in snowfall was due to several small-scale features inducing snow banding, resulting in snowfall rates of over 2.0” per hour, while locations just to the east experienced minimal snowfall. This pattern was observed in many of the storms this month, with the most notable difference occurring in the 2nd – 3rd storm. Another contributing factor to the high snowfall during the 2nd -3rd storm was its resemblance to a spring-like storm, characterized by anomalously high moisture content and relatively warmer temperatures, supporting heavy, wet snow.
Fewer events were recorded over southeastern Colorado, with only four notable events for the month. However, some of these storms brought significant snowfall. The first was the 2nd-3rd event, which brought widespread light snow to the Colorado Springs area and Pueblo, with up to 12” of snow in places, particularly along the Palmer Divide. The second notable event, occurring on the 8th-10th, brought moderate to heavy snow along the Palmer Divide, with totals averaging between 5.0”-9.0” and isolated higher reported accumulations up to 15.0”. Significantly less snowfall was reported in Colorado Springs; between 1.0”-5.0”. The third notable event occurred on the 16th – 17th, where unexpected snow fell only over Central and Southern Colorado Springs, producing up to 4.0” in some areas. The final notable event was on the 27th, where light to moderate snow developed across Colorado Springs, with totals of 3.0-6.0” of snow recorded.
Weather Statistics for Denver International Airport, February 2024
DIA February 2024 Temperature (°F)
| Observed Value | Normal Value | Departure From Normal | |
| Average Max | 50.6°F | 45.7°F | 4.9°F |
| Average Min | 24.6°F | 19.7°F | 4.9°F |
| Monthly Mean | 37.6°F | 32.7°F | 4.9°F |
| Days With Max 90 Or Above | 0 | 0 | 0 |
| Days With Max 32 Or Below | 3 | 5.3 | -2.3 |
| Days With Min 32 Or Below | 26 | 26.1 | -0.1 |
| Days With Min 0 Or Below | 0 | 1.6 | -1.6 |
DIA February 2024 Liquid Precipitation (Inches)
| Observed Value | Date(S) | Normal Value | Departure From Normal | |
| Monthly Total | 1.46” | 0.41” | 1.05” | |
| Yearly Total | 1.74” | 0.79” | 0.95” | |
| Greatest In 24 Hours | 0.76” | 2/2 and 2/3 | ||
| Days With Measurable Precip. | 9 | 5.5 | 3.5 |
March 2024 Preview
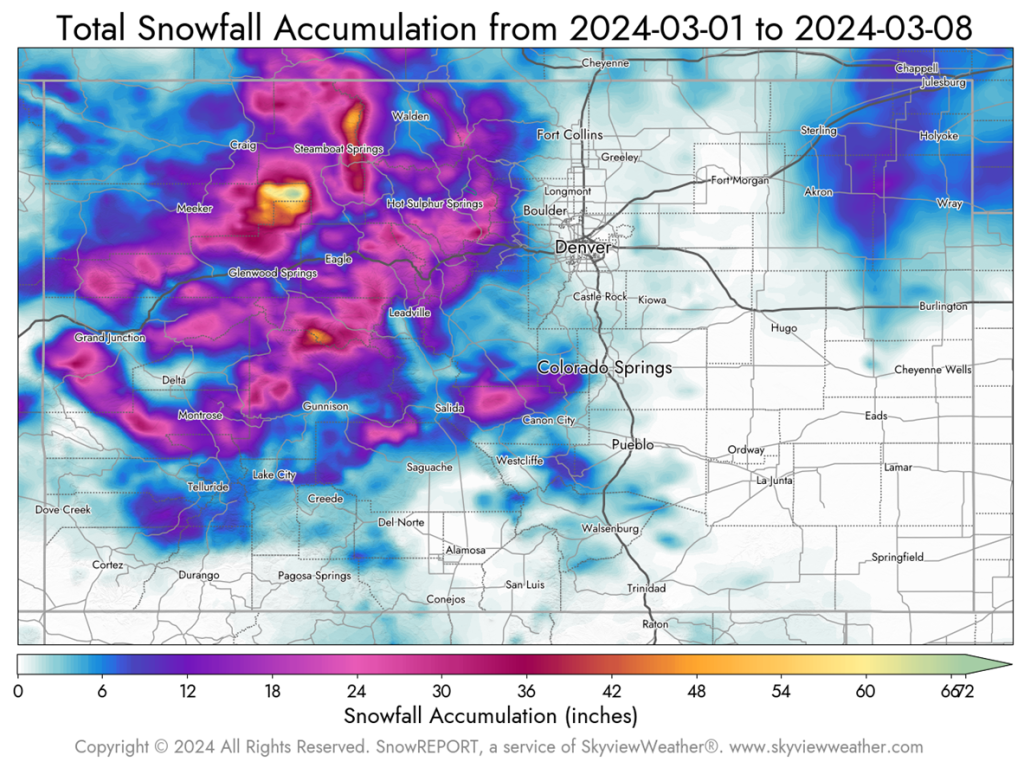
The meteorological progression of March 2024 in Denver has been relatively unremarkable thus far, characterized by the arrival of a few minor weather systems within the initial days of the month. These systems have resulted in minimal accumulation across the Front Range Urban Corridor.
Contrastingly, regions in the high country, specifically those located southwest of Steamboat Springs in proximity to the Park Mountains, have already witnessed substantial snowfall exceeding 70 inches. Northeastern areas of the state near Sterling and Akron have also reported a significant increase in snowfall compared to the previous month, with reports of nearly 12 inches of snow.
As of now, Denver International Airport (DIA) has recorded 0.04” of precipitation, which is 0.10” below the typical average. Current forecasts do not predict any significant storms for Denver in the immediate future. However, considering that March is traditionally the month with the highest snowfall in Colorado, it is likely that high precipitation-producing storms may occur before the month concludes.
Denver’s Monthly Temperature, Rainfall, And Snowfall Extremes For March (1872-Present)
Top 20 Warmest March’s
| Rank | Avg | Year |
| 1 | 50.4 | 1910 |
| 2 | 49.2 | 2012 |
| 3 | 47.9 | 2017 |
| 4 | 47.2 | 1907 |
| 5 | 47.1 | 1986 |
| 6 | 47 | 1918 |
| 7 | 46.5 | 1879 |
| 8 | 46.4 | 2004 |
| 9 | 46.4 | 1946 |
| 10 | 46 | 2007 |
| 11 | 46 | 1887 |
| 12 | 45.7 | 1916 |
| 13 | 45.2 | 1878 |
| 14 | 45.1 | 1911 |
| 15 | 45 | 2015 |
| 16 | 45 | 1873 |
| 17 | 44.9 | 1921 |
| 18 | 44.8 | 1994 |
| 19 | 44.7 | 1972 |
| 20 | 44.5 | 1925 |
Top 20 Wettest March’s
| Rank | Total | Year |
| 1 | 4.56 | 1983 |
| 2 | 3.8 | 2021 |
| 3 | 3.5 | 1992 |
| 4 | 3.1 | 1990 |
| 5 | 3.1 | 1891 |
| 6 | 3.07 | 1905 |
| 7 | 3.05 | 2003 |
| 8 | 3.03 | 1909 |
| 9 | 2.85 | 1959 |
| 10 | 2.75 | 1944 |
| 11 | 2.51 | 1961 |
| 12 | 2.41 | 1949 |
| 13 | 2.36 | 1886 |
| 14 | 2.29 | 1940 |
| 15 | 2.29 | 1927 |
| 16 | 2.27 | 1981 |
| 17 | 2.17 | 1923 |
| 18 | 2.16 | 1929 |
| 19 | 2.12 | 1952 |
| 20 | 2.12 | 1938 |
Top 20 Snowiest March’s
| Rank | Total | Year |
| 1 | 35.2 | 2003 |
| 2 | 34 | 2021 |
| 3 | 32.5 | 1944 |
| 4 | 31.3 | 1891 |
| 5 | 30.5 | 1983 |
| 6 | 29.2 | 1961 |
| 7 | 26.8 | 1959 |
| 8 | 25.7 | 1923 |
| 9 | 25.2 | 1952 |
| 10 | 24.8 | 1929 |
| 11 | 24 | 1981 |
| 12 | 23.9 | 1906 |
| 13 | 23.5 | 2013 |
| 14 | 21.9 | 1990 |
| 15 | 21.8 | 1886 |
| 16 | 20.8 | 1948 |
| 17 | 20.5 | 1970 |
| 18 | 20.4 | 1899 |
| 19 | 20.3 | 1924 |
| 20 | 20.2 | 1909 |
Top 20 Coldest March’s
| Rank | Avg | Year |
| 1 | 26.4 | 1912 |
| 2 | 28 | 1924 |
| 3 | 29 | 1965 |
| 4 | 29.7 | 1906 |
| 5 | 32.1 | 1969 |
| 6 | 32.2 | 1891 |
| 7 | 32.8 | 1958 |
| 8 | 33 | 1964 |
| 9 | 33.1 | 1899 |
| 10 | 33.2 | 1917 |
| 11 | 33.3 | 1932 |
| 12 | 33.5 | 1970 |
| 13 | 33.6 | 1915 |
| 14 | 33.7 | 1952 |
| 15 | 33.7 | 1948 |
| 16 | 33.8 | 2002 |
| 17 | 33.8 | 1888 |
| 18 | 33.9 | 1923 |
| 19 | 34.4 | 1880 |
| 20 | 34.5 | 1944 |
Top 20 Driest March’s
| Rank | Total | Year |
| 1 | 0.03 | 2012 |
| 2 | 0.11 | 1908 |
| 3 | 0.14 | 2008 |
| 4 | 0.14 | 2004 |
| 5 | 0.18 | 1982 |
| 6 | 0.19 | 1999 |
| 7 | 0.2 | 1882 |
| 8 | 0.21 | 1883 |
| 9 | 0.21 | 1880 |
| 10 | 0.22 | 1945 |
| 11 | 0.22 | 1873 |
| 12 | 0.23 | 1935 |
| 13 | 0.23 | 1893 |
| 14 | 0.23 | 1887 |
| 15 | 0.26 | 1997 |
| 16 | 0.28 | 1995 |
| 17 | 0.28 | 1911 |
| 18 | 0.28 | 1898 |
| 19 | 0.3 | 1946 |
| 20 | 0.31 | 1950 |
Top 20 Least Snowiest March’s
| Rank | Total | Year |
| 1 | T | 2017 |
| 2 | T | 2012 |
| 3 | 0.3 | 1883 |
| 4 | 0.4 | 1911 |
| 5 | 0.5 | 1885 |
| 6 | 1.1 | 1887 |
| 7 | 1.8 | 2004 |
| 8 | 2 | 1882 |
| 9 | 2.1 | 1982 |
| 10 | 2.1 | 1908 |
| 11 | 2.5 | 2011 |
| 12 | 2.5 | 1918 |
| 13 | 2.6 | 1986 |
| 14 | 2.6 | 1898 |
| 15 | 2.8 | 1966 |
| 16 | 2.8 | 1910 |
| 17 | 2.9 | 2015 |
| 18 | 3 | 1935 |
| 19 | 3 | 1890 |
| 20 | 3.2 | 1893 |
March Climatology for Denver
(Normal Period 1991-2020 Dia Data)
Temperature
| Temperature | Observed Value |
| Average High | 55.7°F |
| Average Low | 27.5°F |
| Monthly Mean | 41.6°F |
| Days With High 90 Or Above | 0 |
| Days With High 32 Or Below | 1.7 |
| Days With Low 32 Or Below | 23.2 |
| Days With Lows Zero Or Below | 0.2 |
Precipitation
| Precipitation | Observed Value |
| Monthly Mean | 0.86” |
| Days With Measurable Precipitation | 6.2 |
| Average Snowfall In Inches | 8.8” |
| Days With 1.0 Inch Of Snow Or More | NA |
Miscellaneous Averages
| Miscellaneous Averages | |
| Heating Degree Days | 726 |
| Cooling Degree Days | 0 |
| Wind Speed (Mph) | 9.7 mph |
| Wind Direction | South |
| Days With Thunderstorms | <1 |
| Days With Dense Fog | 1 |
| Percent Of Sunshine Possible | 69% |
Extremes
| Extremes | |
| Record High | 84 on 3/26/1971 |
| Record Low | -11 on 3/28/1886 |
| Warmest | 50.4 in 1910 |
| Coldest | 26.4 in 1912 |
| Wettest | 4.56” in 1983 |
| Driest | 0.03” In 2012 |
| Snowiest | 35.2” in 2003 |
| Least Snowy | TR in 2012 and 2017 |
Winter 2023/2024 Snowfall Accumulation for the Colorado Eastern Plains
| City | Oct | Nov | Dec | Jan | Feb | Mar | Apr | Total |
| Aurora | 6.6 | 2.3 | 10.4 | 3.9 | 11.6 | 34.8 | ||
| Boulder | 5 | 7.8 | 9.2 | 8.5 | 13.9 | 44.4 | ||
| Brighton | 4.7 | 4 | 1.1 | 2.2 | 7.8 | 19.8 | ||
| Broomfield | 4.3 | 5.3 | 3.2 | 5.1 | 13.9 | 31.8 | ||
| Castle Rock | 9 | 2.1 | 9.7 | 12.1 | 17.4 | 50.3 | ||
| Colorado Springs Airport | 0 | 1.1 | 8.4 | 5.1 | 11.5 | 26.1 | ||
| Denver DIA | 7.5 | 2.9 | 1.4 | 4.2 | 13.7 | 29.7 | ||
| Denver Downtown | 5.3 | 2.1 | 6.2 | 4.6 | 10.9 | 29.1 | ||
| Golden | 10.7 | 14 | 14.6 | 13.2 | 37.7 | 90.2 | ||
| Fort Collins | 5.7 | 9.6 | 0 | 3.3 | 5.7 | 24.3 | ||
| Highlands Ranch | 5.8 | 1.8 | 6.9 | 5.1 | 11.6 | 31.2 | ||
| Lakewood | 8.6 | 4.1 | 11.3 | 5.5 | 21.3 | 50.8 | ||
| Littleton | 10 | 1.6 | 6 | 3.7 | 12.3 | 33.6 | ||
| Monument | 6.5 | 1.5 | 14.8 | 14.1 | 20.3 | 57.2 | ||
| Parker | 7.4 | 1 | 8.8 | 9.1 | 12.3 | 38.6 | ||
| Sedalia – Hwy 67 | 10.5 | 3.3 | 9.4 | 12.8 | 20 | 56 | ||
| Thornton | 4 | 4.4 | 4.4 | 4.4 | 12.8 | 30 | ||
| Westminster | 5.1 | 4.7 | 5.3 | 4.8 | 13.7 | 33.6 | ||
| Wheat Ridge | 6 | 3.4 | 6.9 | 5.3 | 22.1 | 43.7 | ||
| Windsor | 3.5 | 5.5 | TR | 4.9 | 9 | 22.9 |
The Skyview Weather Newsletter is a monthly publication that aims to provide readers with engaging and informative content about meteorological science. Each issue features articles thoughtfully composed by Skyview’s team of meteorologists, covering a wide range of topics from the birth of Doppler Radar to the impact of weather phenomena. The newsletter serves as a platform to share the latest advancements in weather forecasting technology and the science behind it, enhancing our understanding of weather.
Skyview Weather has been a pillar for reliable weather services for over 30 years, providing unparalleled forecasts and operations across the Continental US. We offer a comprehensive suite of services that range from live weather support to detailed forecasts, extensive weather data collection, and weather reporting. Our clients, ranging from concert venues to golf courses, theme parks to hotels, schools to police departments, and more, rely on Skyview Weather for winter and summer weather alerts, now available on the Skyview Weather mobile app. These alerts cover a broad spectrum of weather conditions, including snow, lightning, hail, tornadoes, severe weather, and heavy rain. Learn more about how Skyview Weather products and services can support your organization through severe, winter, flood, and fire weather.