
September 2024 Skyview Weather Monthly Newsletter
Feature Article
From F to EF: Understanding the Evolution of Tornado Rating Scales
Tornadoes are among the most destructive and awe-inspiring forces of nature, capable of unleashing unparalleled devastation in a matter of minutes. Understanding the intensity of these swirling vortexes has been a challenge for meteorologists for decades. Over time, various methods have been developed to categorize tornadoes, with the most notable transition occurring from the Fujita (F) scale to the Enhanced Fujita (EF) scale. Let’s delve into the evolution of these rating systems and explore the differences in the factors utilized to assess tornado intensity.
The Fujita Scale (F Scale)
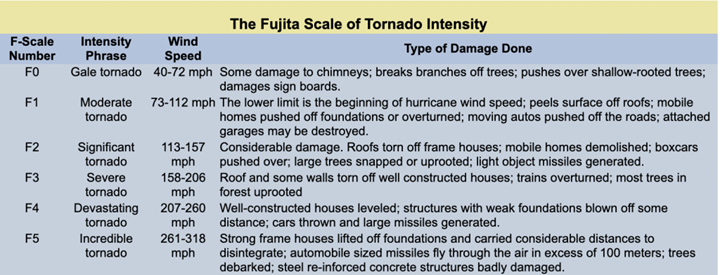
In the early 1970s, Dr. Ted Fujita, a renowned Japanese-American meteorologist, introduced the Fujita Scale as a means of classifying tornadoes based on the damage they caused. The scale ranged from F0 to F5, with each category corresponding to a range of wind speeds and associated damage. For instance, an F0 tornado typically caused light damage to trees and buildings, while an F5 tornado was capable of leveling well-built homes and tossing vehicles like toys.
The F Scale primarily relied on observed damage to determine tornado intensity. Damage indicators such as trees, buildings, and vehicles were examined to estimate wind speeds, which were then matched to the appropriate F category. However, this approach had limitations, as damage patterns could vary widely depending on construction quality, terrain, and other factors.
The Enhanced Fujita Scale (EF Scale)
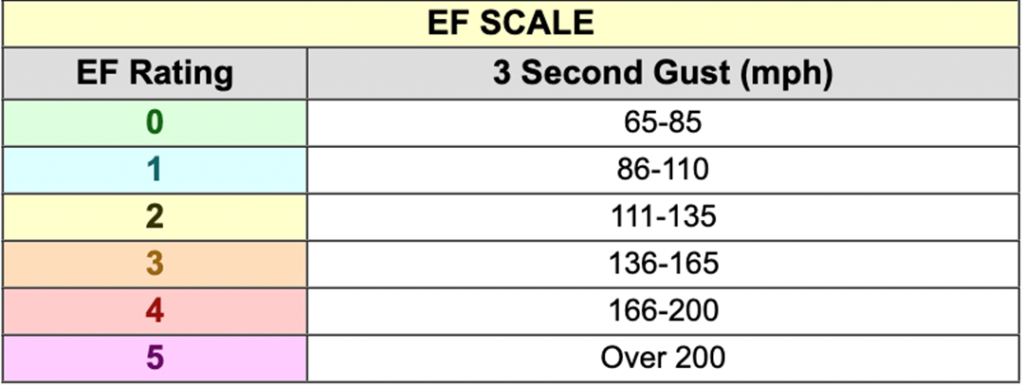
Recognizing the need for a more robust and scientifically grounded rating system, the Enhanced Fujita Scale was introduced in 2007. Developed by a team of meteorologists and engineers, the EF Scale builds upon the foundation laid by the original F Scale while incorporating advancements in meteorological research and engineering.
Unlike its predecessor, which relied solely on observed damage, the EF Scale takes into account a broader range of factors to assess tornado intensity. These factors include not only damage indicators but also the construction quality of affected buildings, vegetation, and soil conditions. Additionally, advancements in Doppler radar technology have enabled meteorologists to estimate wind speeds more accurately, providing valuable data for EF Scale assessments.
Key Differences in Factors Utilized
1. Damage Indicators: Both the F and EF Scales utilize damage indicators such as trees, buildings, and vehicles to assess tornado intensity. However, the EF Scale places greater emphasis on the specific types of damage observed and the degree of destruction, allowing for more precise categorization.
2. Construction Quality: The EF Scale considers the quality of construction when evaluating damage to buildings. Structures are classified into five different types, ranging from weak frame houses to well-built homes and commercial buildings. This nuanced approach helps account for variations in building standards and materials.
3. Vegetation and Soil Conditions: In addition to built structures, the EF Scale factors in damage to vegetation and changes in soil conditions caused by tornadoes. This holistic approach provides valuable insights into the intensity and path of the tornado, helping meteorologists refine their assessments.
4. Doppler Radar Data: While both scales rely primarily on observed damage, the EF Scale incorporates Doppler radar data to supplement on-the-ground assessments. Doppler radar can measure wind speeds within a tornado’s circulation, providing valuable data for estimating tornado intensity and verifying EF Scale ratings.
Conclusion
The transition from the Fujita Scale to the Enhanced Fujita Scale represents a significant advancement in tornado intensity classification. By incorporating a broader range of factors and leveraging technological innovations, the EF Scale provides meteorologists with a more comprehensive and accurate method for assessing tornadoes. While challenges remain in accurately rating tornado intensity, ongoing research and advancements in technology continue to enhance our understanding of these powerful natural phenomena.
Colorado Drought Update
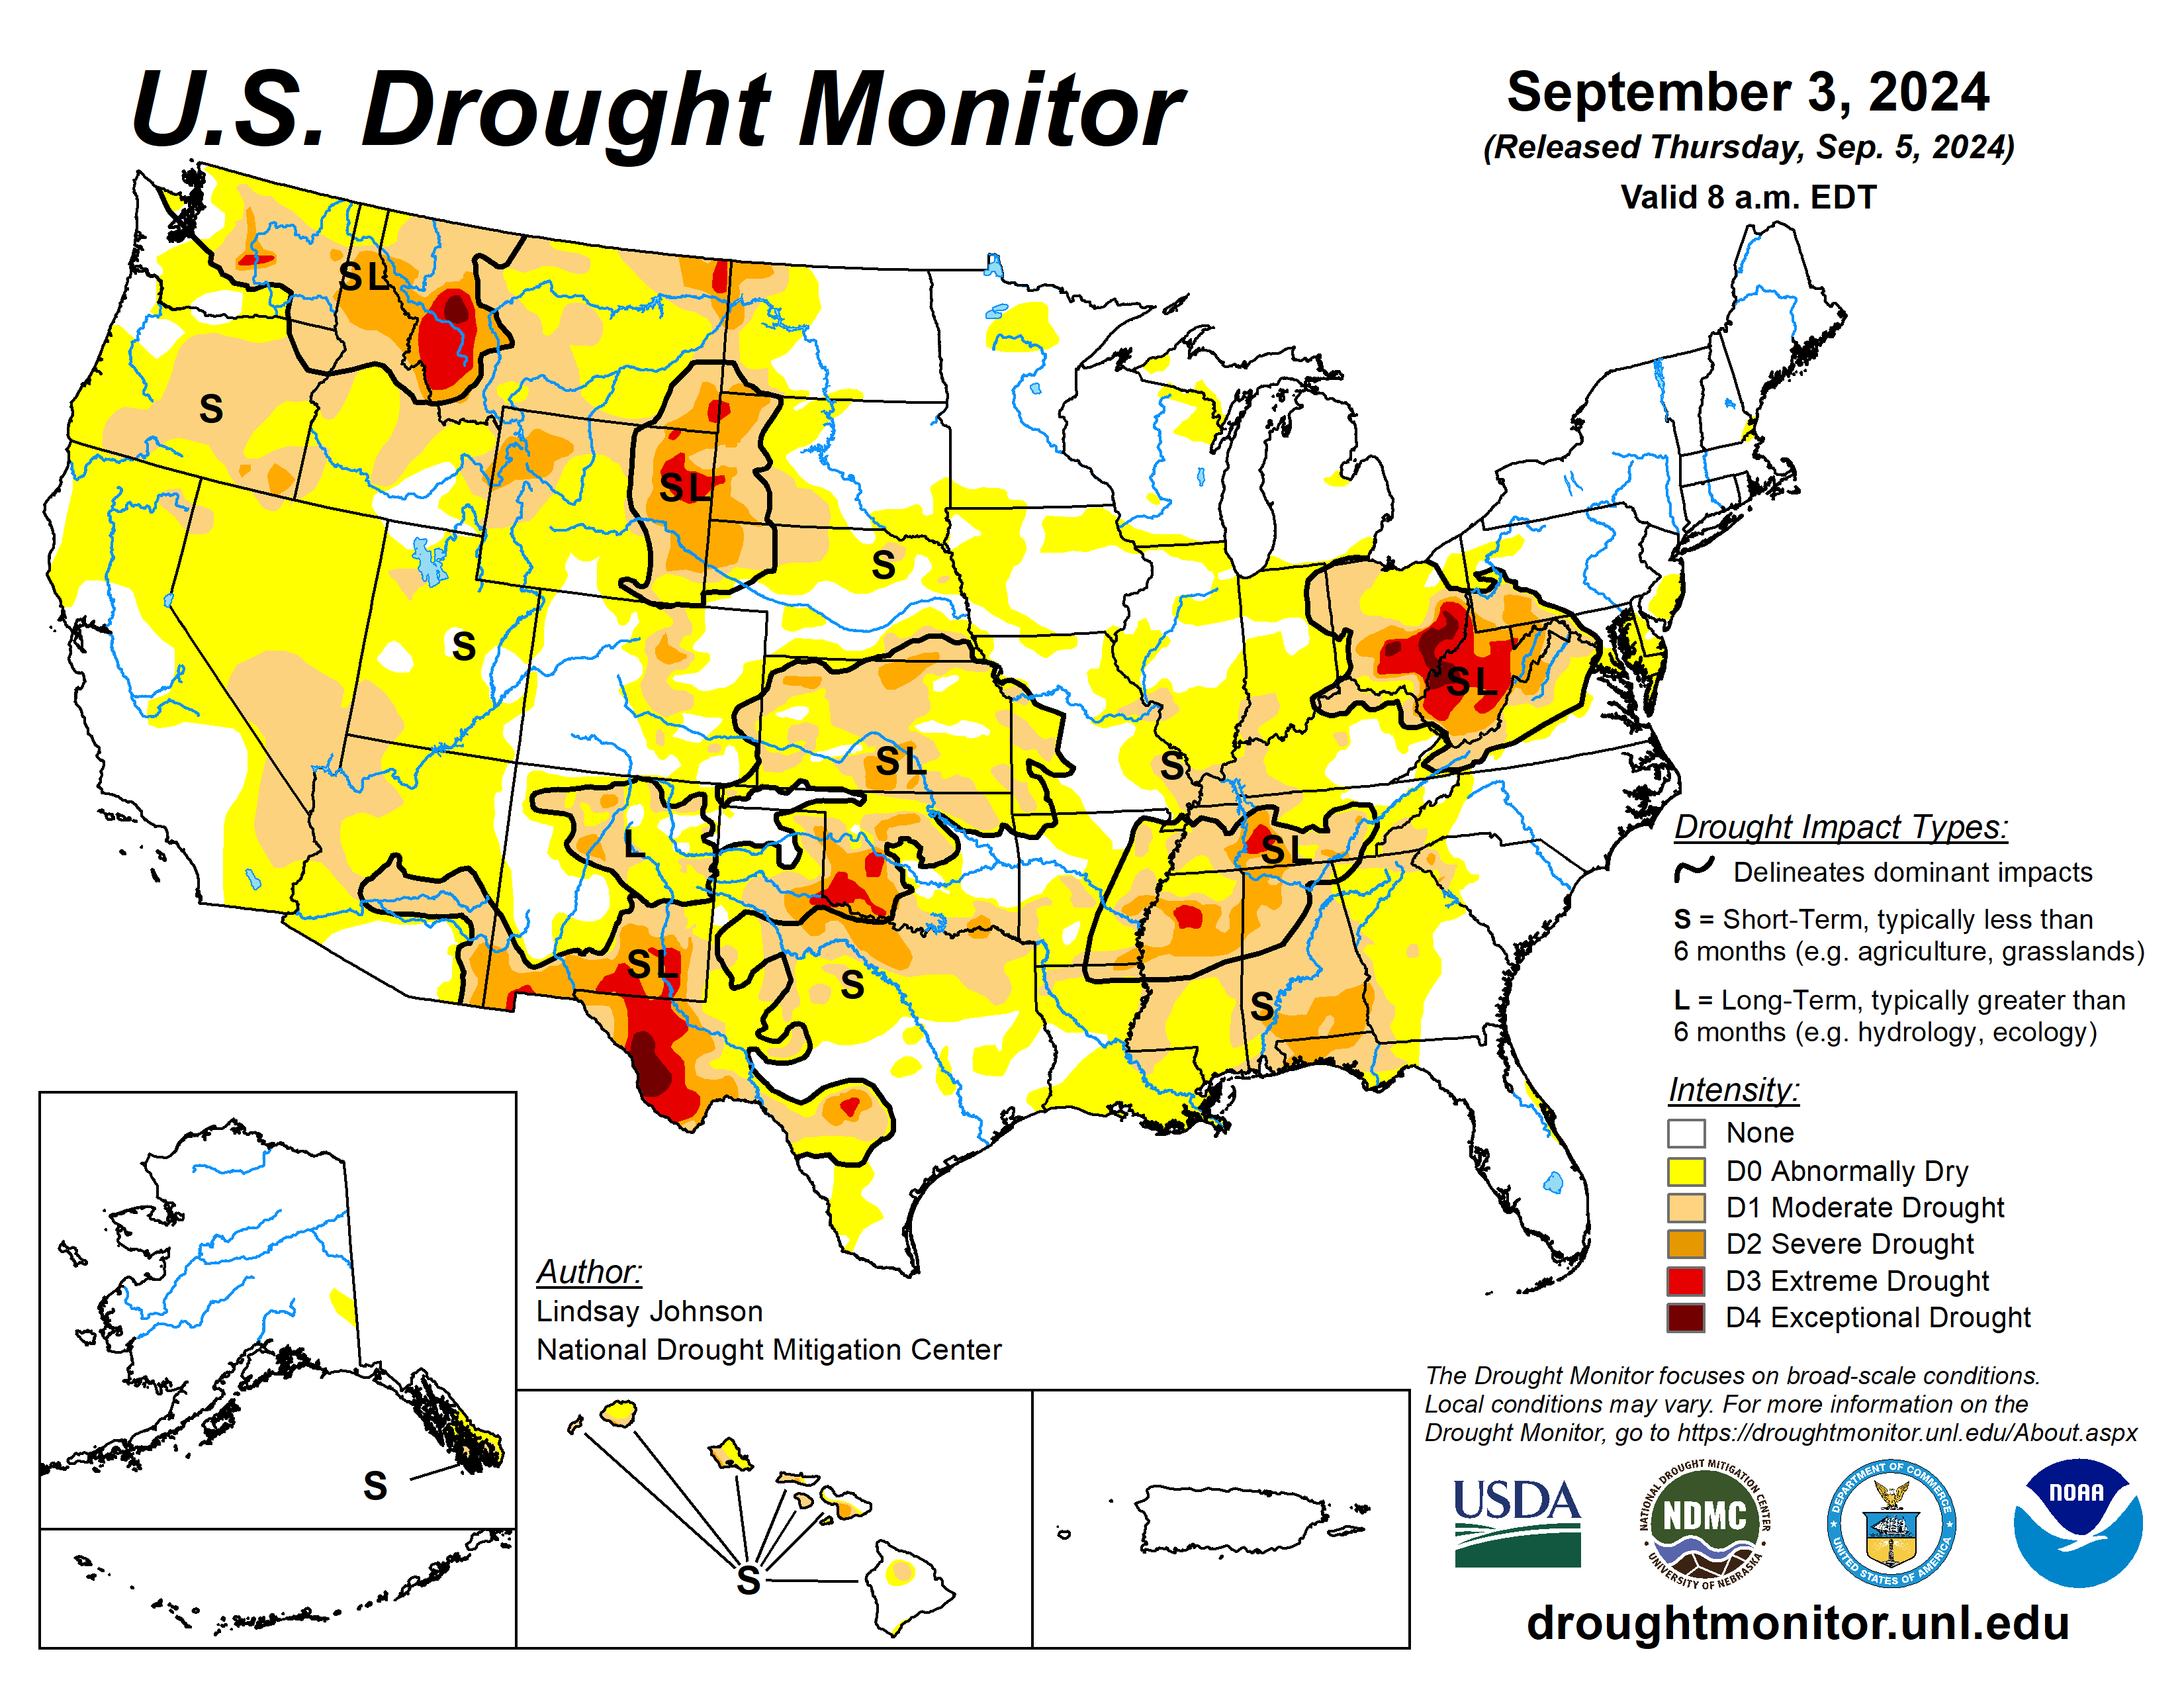
August continued to create drought conditions for much of the western US. A late season surge of the monsoon delivered a lot of moisture to Colorado’s western slope, much more than usual, which alleviated drought conditions there. The rest of the Desert Southwest, Great Basin, Pacific Northwest, and Northern Rockies developed more and more severe drought conditions. Parts of the Rio Grande Texas border up through the Red River and Ohio River Valley are struggling greatly as well.
August 2024 Temperature Anomaly Forecast
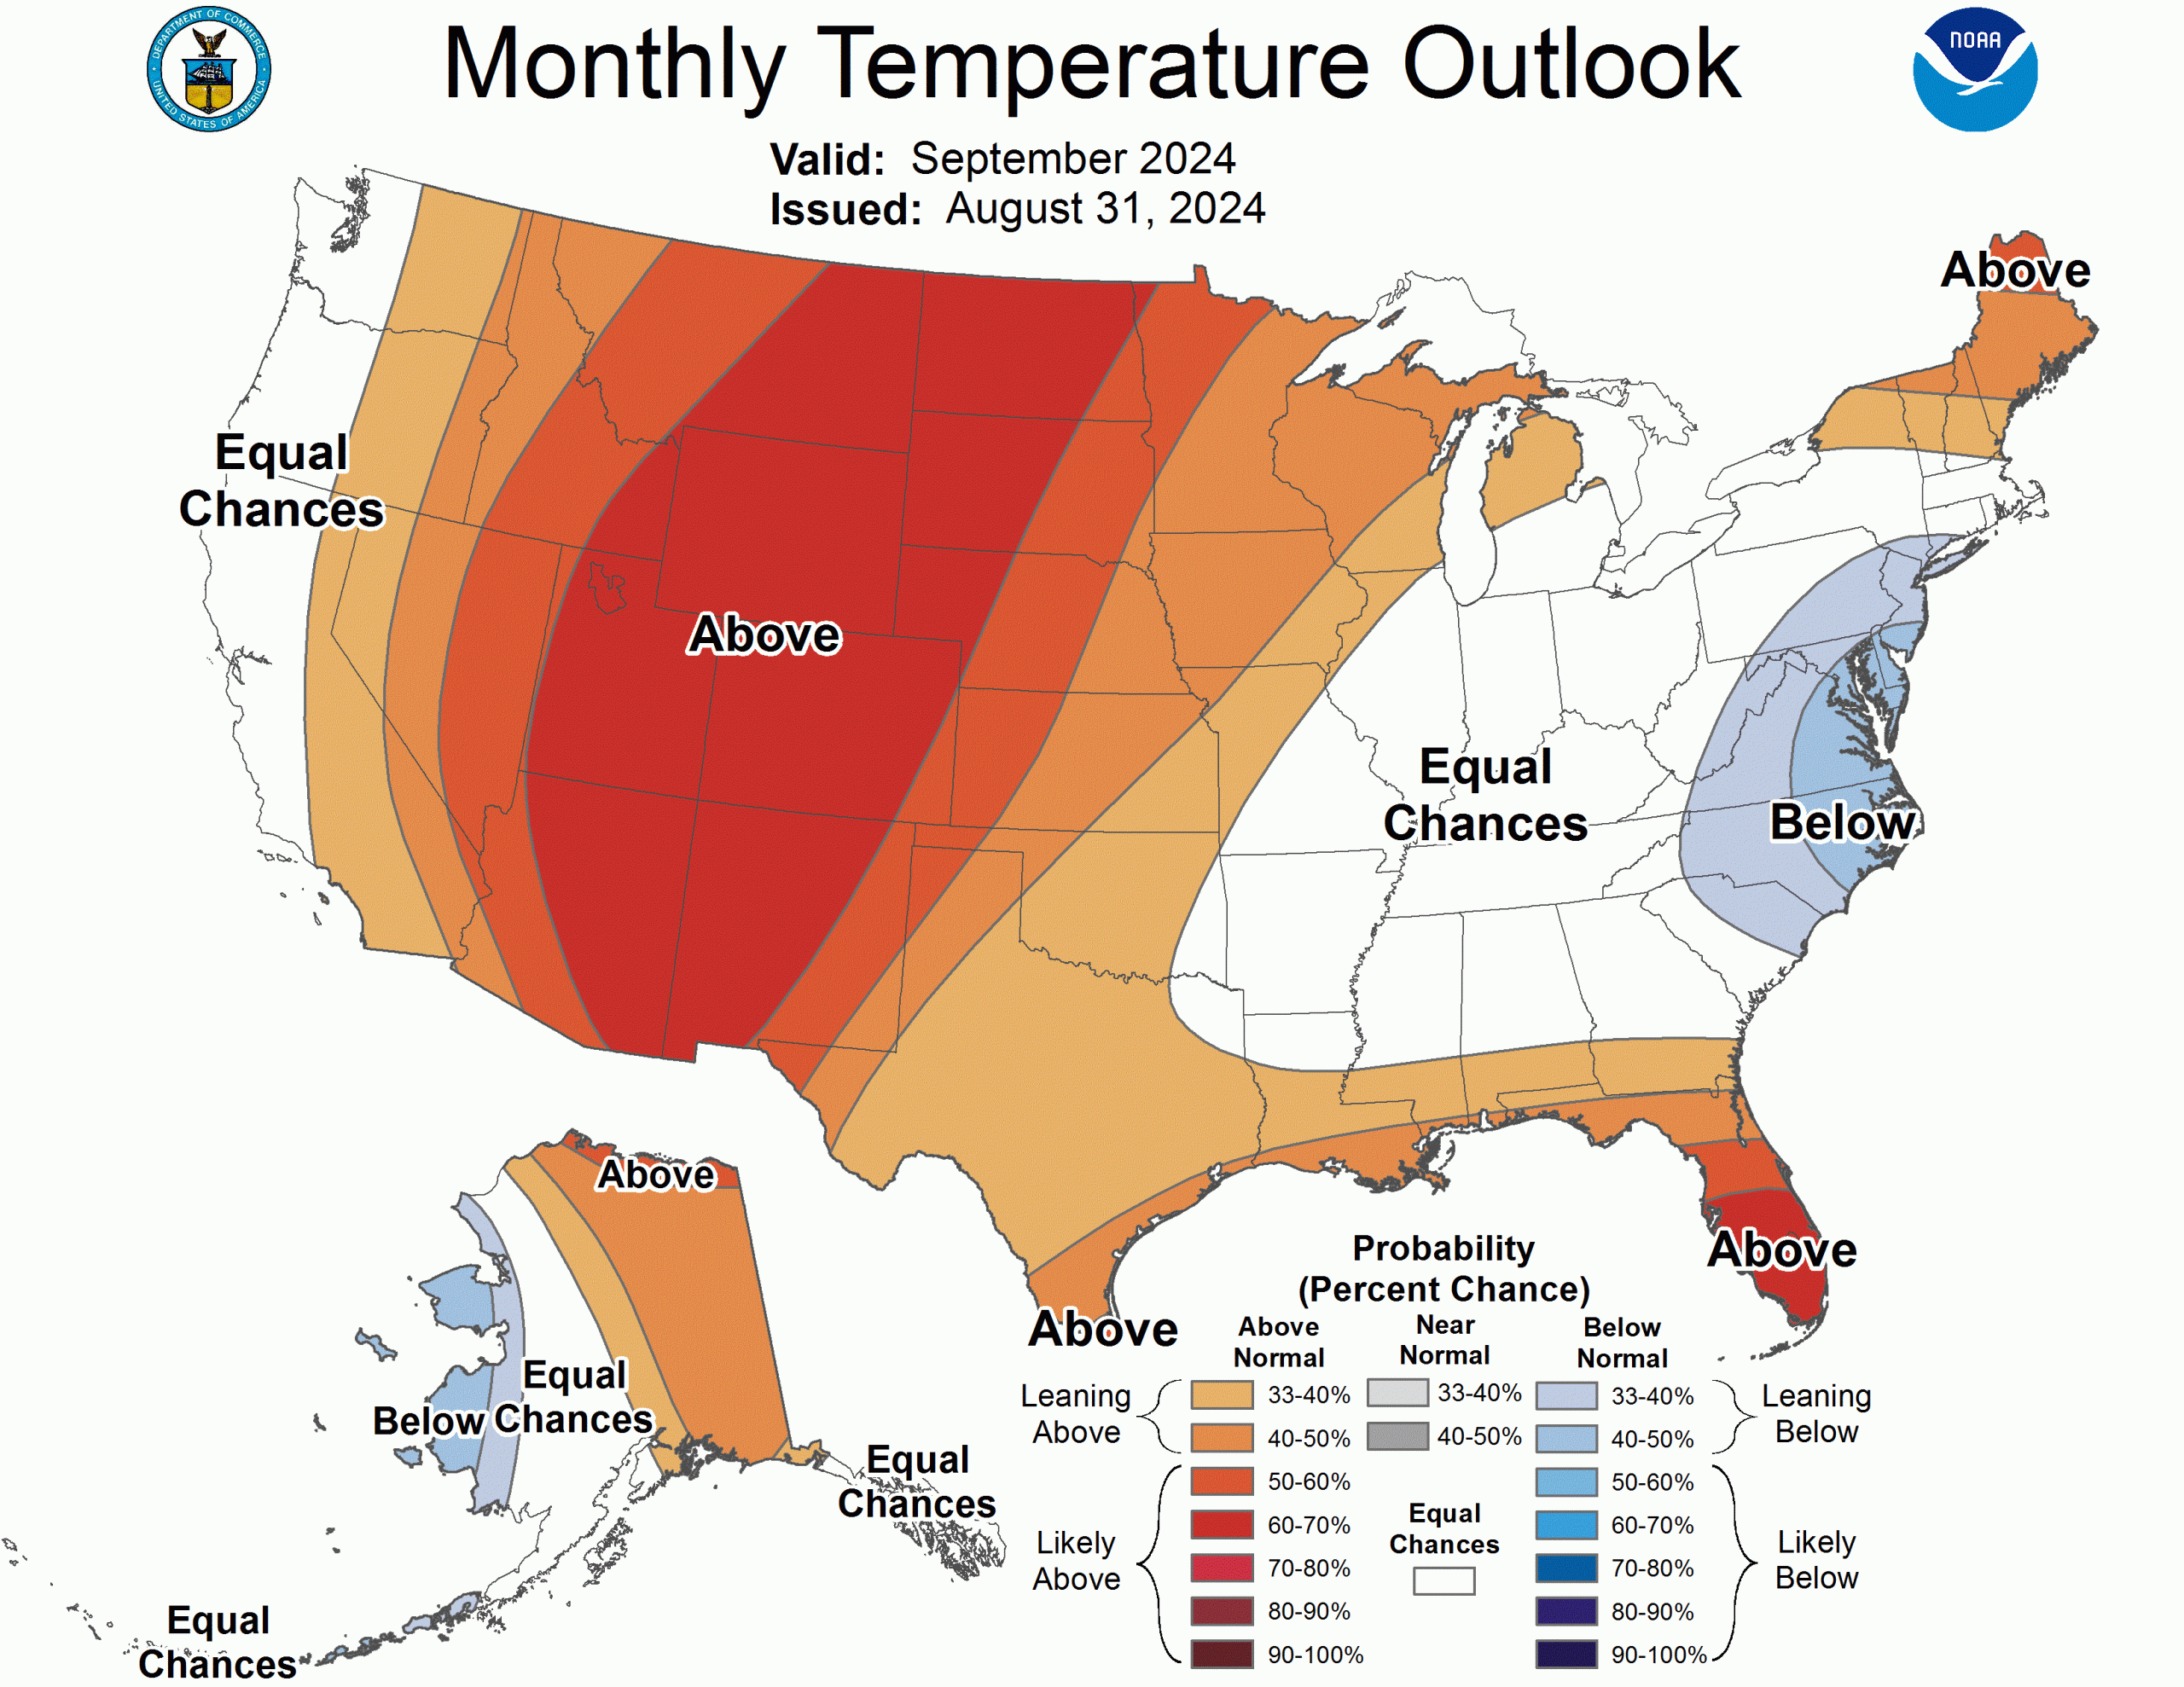
The Climate Prediction Center is anticipating a September that is almost certainly going to be above average in temperature for Colorado, as well as much of the desert southwest through the northern Great Plains. The West Coast should have a seasonal September, as well as much of the Ohio River Valley and southern US, while the Mid Atlantic Coast will be the only portion of the lower 48 that is anticipated to have below normal temperatures for the month of September.
August 2024 Precipitation Anomaly Forecast
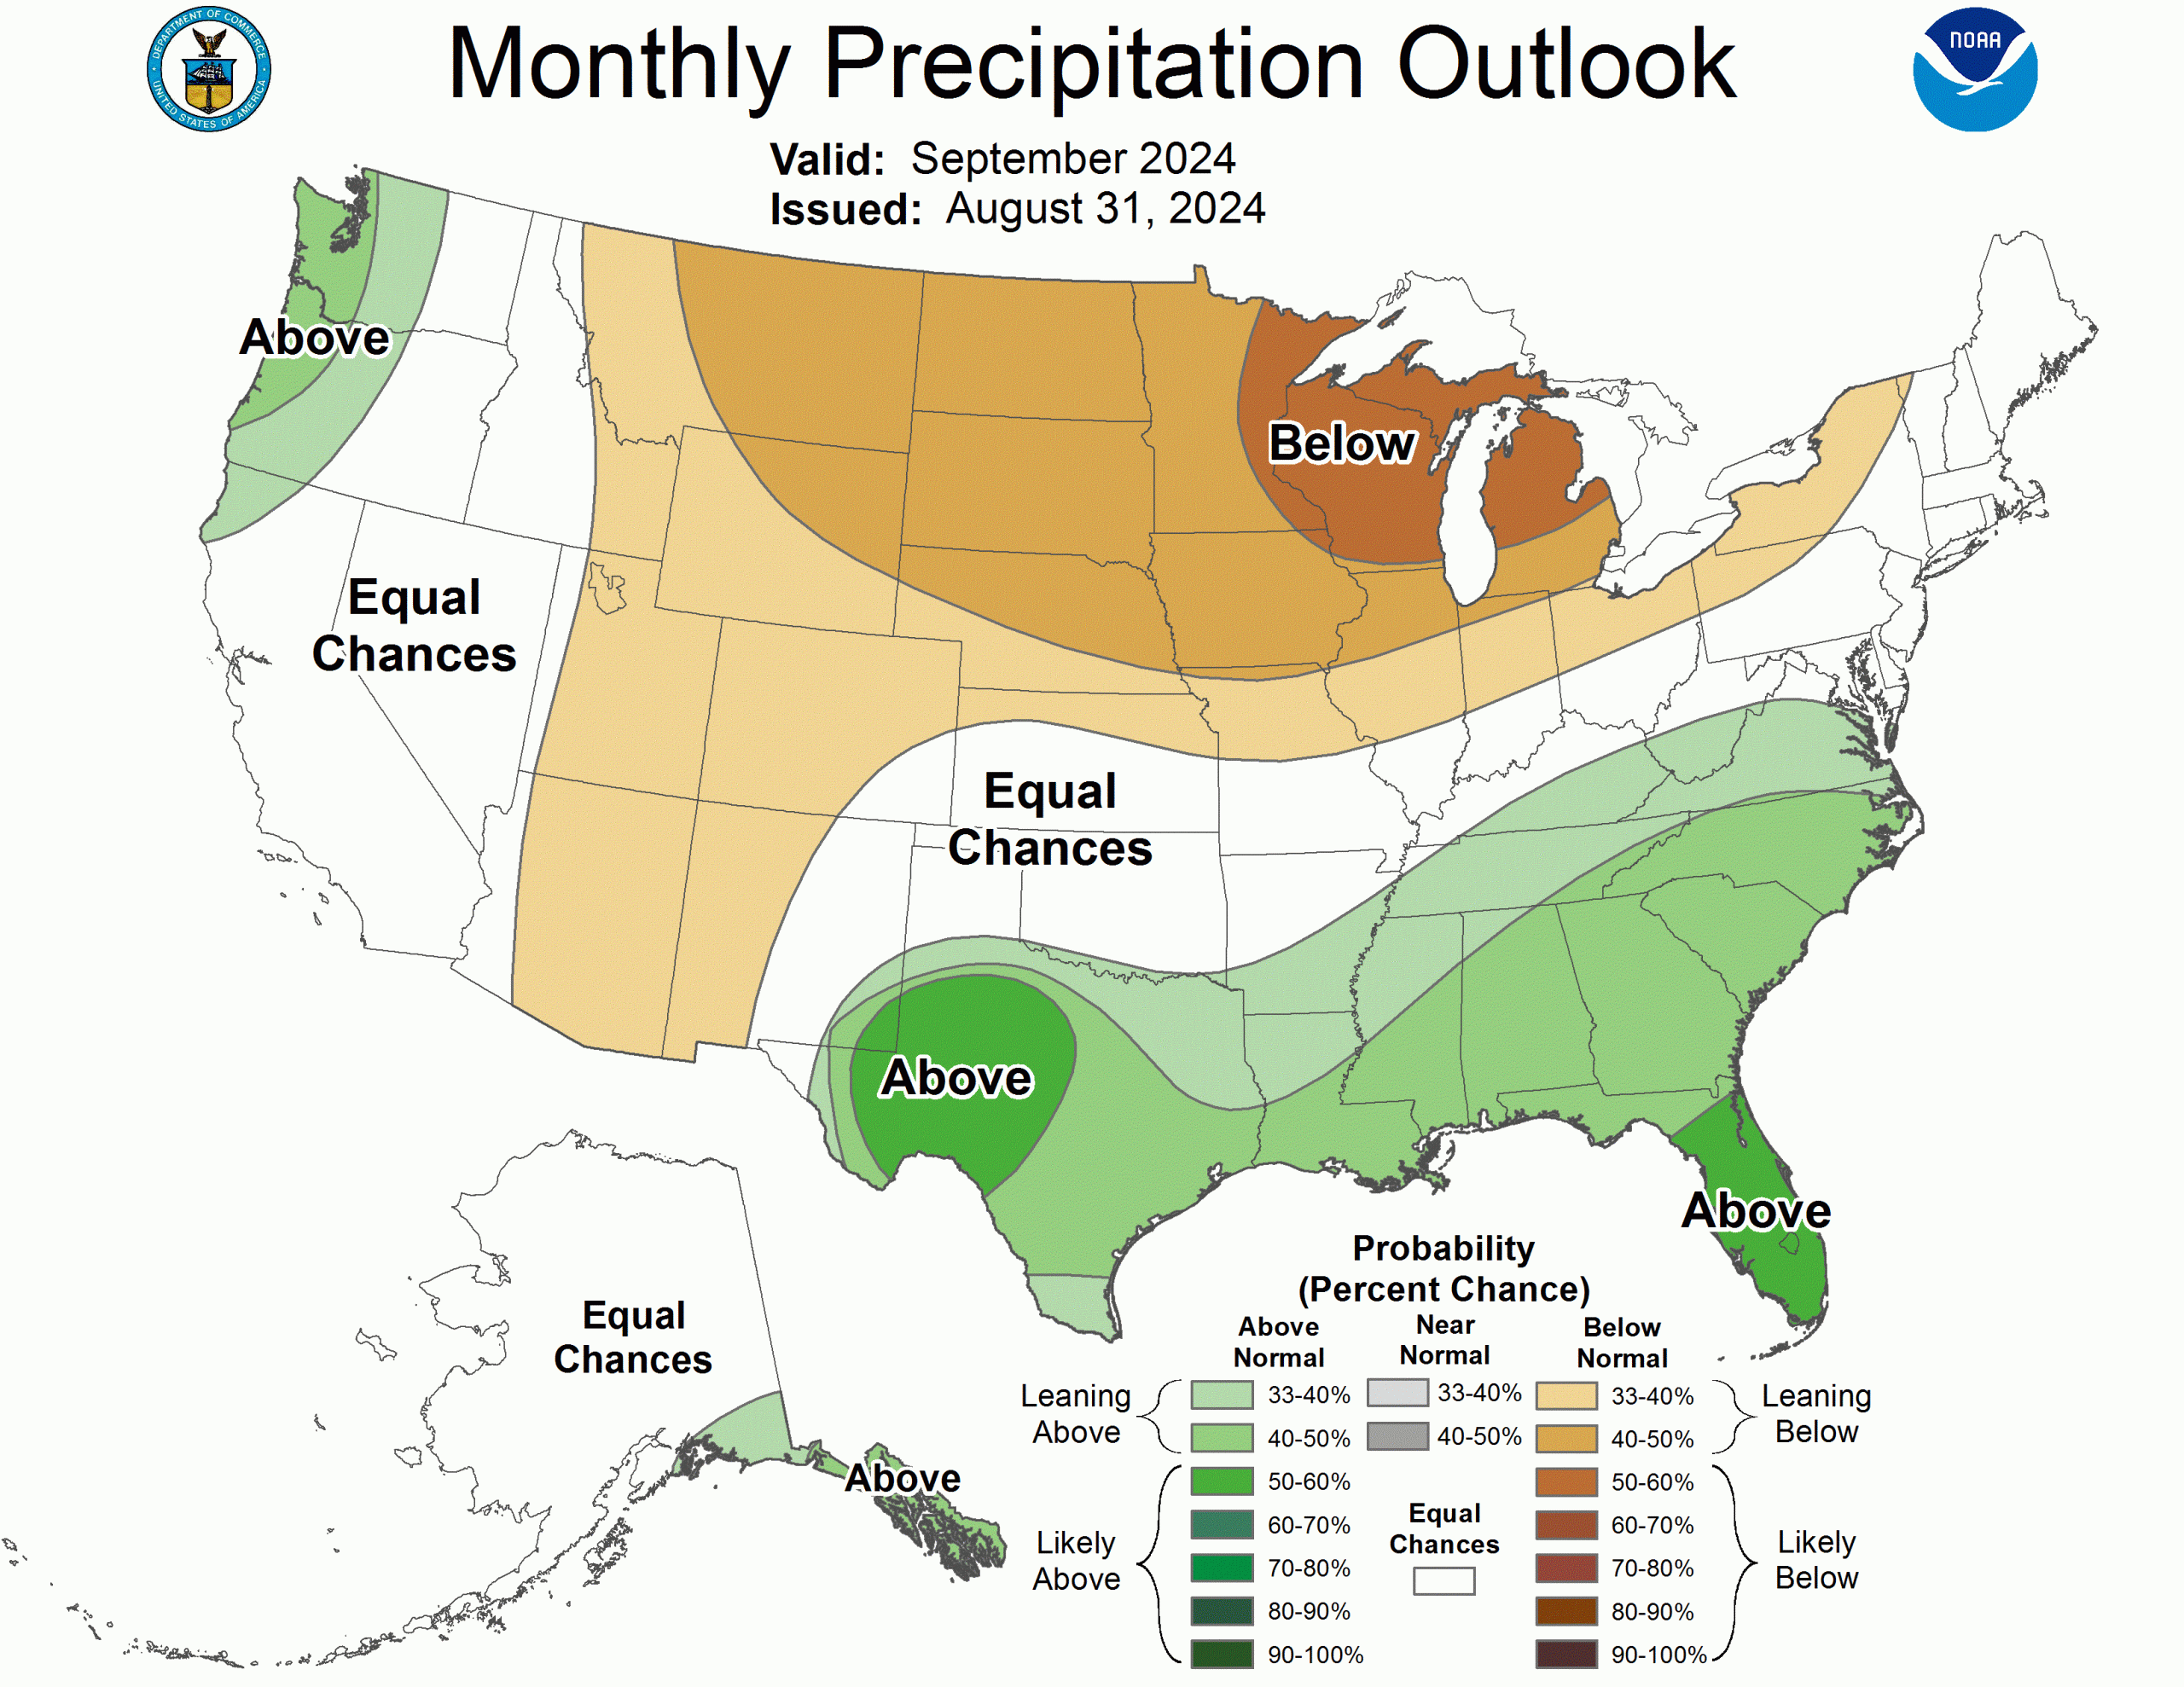
The Climate Prediction Center’s Precipitation Outlook for September doesn’t show a ton of abnormal precipitation values across the lower 48 states or Alaska. A wet summer will continue into the fall for the Gulf Coast states and Florida, as well a local spot of abnormal precipitation over western Texas. The upper Midwest, on the other hand, can anticipate a drier than normal month. The beginnings of winter fall and winter rainfall appear to arrive a little early in the Pacific Northwest.
Weather Summary for Colorado, August 2024
The meteorological summer concluded with a warm August that brought Denver up to its second warmest summer since records were kept in the late 1800s. Between the months of June-August, 2012 was the only year that Denver was warmer on average than it was in 2024. This was largely thanks to a hot August, with average afternoon highs coming in above 90°F, which is over 3° warmer than Denver’s climatological normal.
August began hot, with a heatwave that competed with the one that occurred in early July. On August 4th, a temperature of 102°F was recorded at Denver International Airport, which would be an all time record for the day. Through August, Denver racked up a total of 54 days of 90°F or warmer.
What was a very dry summer stayed relatively dry through August, though a late arriving monsoon delivered a lots of hydrological relief to Colorado’s western slope. Much of the region west of the Continental Divide received greater than 300% of normal precipitation for the month of August. In fact, the only portions of Colorado to receive significantly below average precipitation for the month of August were in and around the Denver urban corridor.
Weather Statistics for Denver International Airport (DIA), August 2024
DIA Temperature (°F), August 2024
| Observed Value | Normal Value | Departure From Normal | |
| Average Max | 90.6°F | 87.5°F | 3.1°F |
| Average Min | 60.6°F | 58.3°F | 2.3°F |
| Monthly Mean | 75.6°F | 72.9°F | 2.7°F |
| Days With Max 90 Or Above | 19 | 13.8 | 5.2 |
| Days With Max 32 Or Below | 0 | 0 | 0 |
| Days With Min 32 Or Below | 0 | 0 | 0 |
| Days With Min 0 Or Below | 0 | 0 | 0 |
| Highest | 102°F on 8/4 | 99 | 3 |
| Lowest | 50°F on 8/30 | 51 | -1 |
DIA Liquid Precipitation (Inches), July 2024
| Observed Value | Date(s) | Normal Value | Departure From Normal | |
| Monthly Total | 0.92” | 1.58” | -0.66” | |
| Yearly Total | 10.75” | 11.19” | -0.44” | |
| Greatest In 24 Hours | 0.30” | 08/12 | ||
| Days With Measurable Precip. | 9 | 7.5 | 1.5 |
2024 Rainfall Accumulation for the Colorado Eastern Plains
| City | May | June | July | Aug | Sept | Total |
| Aurora (Central) | 1.17 | 0.29 | 0.74 | 0.61 | 2.81 | |
| Boulder | 0.26 | 0.35 | 0.50 | 1.32 | 2.43 | |
| Brighton | 0.57 | 0.41 | 1.04 | 1.30 | 3.32 | |
| Broomfield | 0.77 | 0.35 | 0.94 | 1.07 | 3.13 | |
| Castle Rock | 1.59 | 1.65 | 2.28 | 2.78 | 8.30 | |
| Colo Sprgs Airport | 0.82 | 0.51 | 2.06 | 3.29 | 6.68 | |
| Denver DIA | 1.70 | 0.36 | 1.10 | 0.92 | 4.08 | |
| Denver Downtown | 1.21 | 0.07 | 2.05 | 0.71 | 4.04 | |
| Golden | 0.98 | 0.58 | 0.91 | 2.48 | 4.95 | |
| Fort Collins | 0.93 | 0.51 | 1.34 | 1.51 | 4.29 | |
| Highlands Ranch | 1.81 | 0.52 | 0.74 | 1.74 | 4.81 | |
| Lakewood | 1.03 | 0.74 | 1.26 | 1.85 | 4.88 | |
| Littleton | 1.39 | 0.38 | 0.50 | 1.00 | 3.27 | |
| Monument | 1.79 | 0.50 | 2.01 | 1.03 | 5.33 | |
| Parker | 1.63 | 1.01 | 1.10 | 2.72 | 6.46 | |
| Sedalia – Hwy 67 | 1.94 | 1.03 | 0.94 | 1.89 | 5.80 | |
| Thornton | 0.37 | 0.28 | 1.20 | 0.94 | 2.79 | |
| Westminster | 0.65 | 0.47 | 0.91 | 0.94 | 2.97 | |
| Wheat Ridge | 0.75 | 0.42 | 0.98 | 0.72 | 2.87 | |
| Windsor | 0.94 | 1.36 | 0.93 | 2.11 | 5.34 |
September 2024 Preview
As the thunderstorm season comes to an end, Colorado is transitioning from summer to autumn. Meteorological autumn began on the 1st of the month, but for those who prefer to follow solar cycles, “fall” will officially begin on Sunday, September 22nd, when there will be an equal 12 hours of daylight and darkness. This transition brings a significant reduction in daylight, resulting in a noticeable drop in temperatures. Average highs that were in the mid 80s at the start of the month are expected to decrease into the low 70s by the end of September. Average lows will also drop from the mid 50s, into the low to mid 40s during this period.
While some years may bring the first snowfall and freezing temperatures in September, most years see no snow along the I-25 corridor until October. The long-range outlook from the drought monitor suggests above-normal temperatures and below-normal precipitation for much of Colorado, with northern areas having the best chance of normal precipitation. The transition from the higher thunderstorm months of May, June, July, and August to September typically results in a decrease in normal precipitation, with an average of 1.35”. So far, Denver International Airport (DIA) has not received any measurable precipitation for the month. Due to the relatively dry start to the month at DIA, it is expected to once again end up below normal precipitation, unless there are a few isolated moderate to heavy rainfall events, however, storms are anticipated to be infrequent during the month. Temperature-wise, September starts off very warm with regular 90°F days, but as the month progresses, even the warmer days will gradually shift into the 80s. Some days may be above normal, while others may approach or fall below the normal temperature range. This fluctuation is typical during the transition from late summer into winter. Overall, above-normal temperatures are likely for most areas in September, accompanied by below-normal precipitation. A mild and dry late summer will result in good leaf peeping throughout the Rockies and across the I-25 corridor throughout the month of September!
September Climatology for Denver
(Normal Period 1991-2020 Dia Data)
Temperature
| AVERAGE HIGH | 79.6°F |
| AVERAGE LOW | 50.0°F |
| MONTHLY MEAN | 64.8°F |
| DAYS WITH HIGH 90 OR ABOVE | 4.2 |
| DAYS WITH HIGH 32 OR BELOW | 0.0 |
| DAYS WITH LOW 32 OR BELOW | 0.7 |
| DAYS WITH LOWS ZERO OR BELOW | 0.0 |
Precipitation
| MONTHLY MEAN | 1.35” |
| DAYS WITH MEASURABLE PRECIPITATION | 6 |
| AVERAGE SNOWFALL IN INCHES | 0.8” |
| DAYS WITH 1.0 INCH OF SNOW OR MORE | <1 |
Miscellaneous Averages
| HEATING DEGREE DAYS | 105 |
| COOLING DEGREE DAYS | 99 |
| WIND SPEED (MPH) | 9.3 mph |
| WIND DIRECTION | South |
| DAYS WITH THUNDERSTORMS | 5-6 Estimate |
| DAYS WITH DENSE FOG | 1 |
| PERCENT OF SUNSHINE POSSIBLE | 74% |
Extremes
| RECORD HIGH | 101 on 9/5/2020 |
| RECORD LOW | 17 on 9/29/1985 |
| WARMEST | 69.4 in 2015 |
| COLDEST | 54.7 in 1912 |
| WETTEST | 5.61” in 2013 |
| DRIEST | TR in 1944, 1892 |
| SNOWIEST | 17.2” in 1971 |
| LEAST SNOWY | 0.0” |
The Skyview Weather Newsletter is a monthly publication that aims to provide readers with engaging and informative content about meteorological science. Each issue features articles thoughtfully composed by Skyview’s team of meteorologists, covering a wide range of topics from the birth of Doppler Radar to the impact of weather phenomena. The newsletter serves as a platform to share the latest advancements in weather forecasting technology and the science behind it, enhancing our understanding of weather.
Skyview Weather has been a pillar for reliable weather services for over 30 years, providing unparalleled forecasts and operations across the Continental US. We offer a comprehensive suite of services that range from live weather support to detailed forecasts, extensive weather data collection, and weather reporting. Our clients, ranging from concert venues to golf courses, theme parks to hotels, schools to police departments, and more, rely on Skyview Weather for winter and summer weather alerts, now available on the Skyview Weather mobile app. These alerts cover a broad spectrum of weather conditions, including snow, lightning, hail, tornadoes, severe weather, and heavy rain. Learn more about how Skyview Weather products and services can support your organization through severe, winter, flood, and fire weather.
