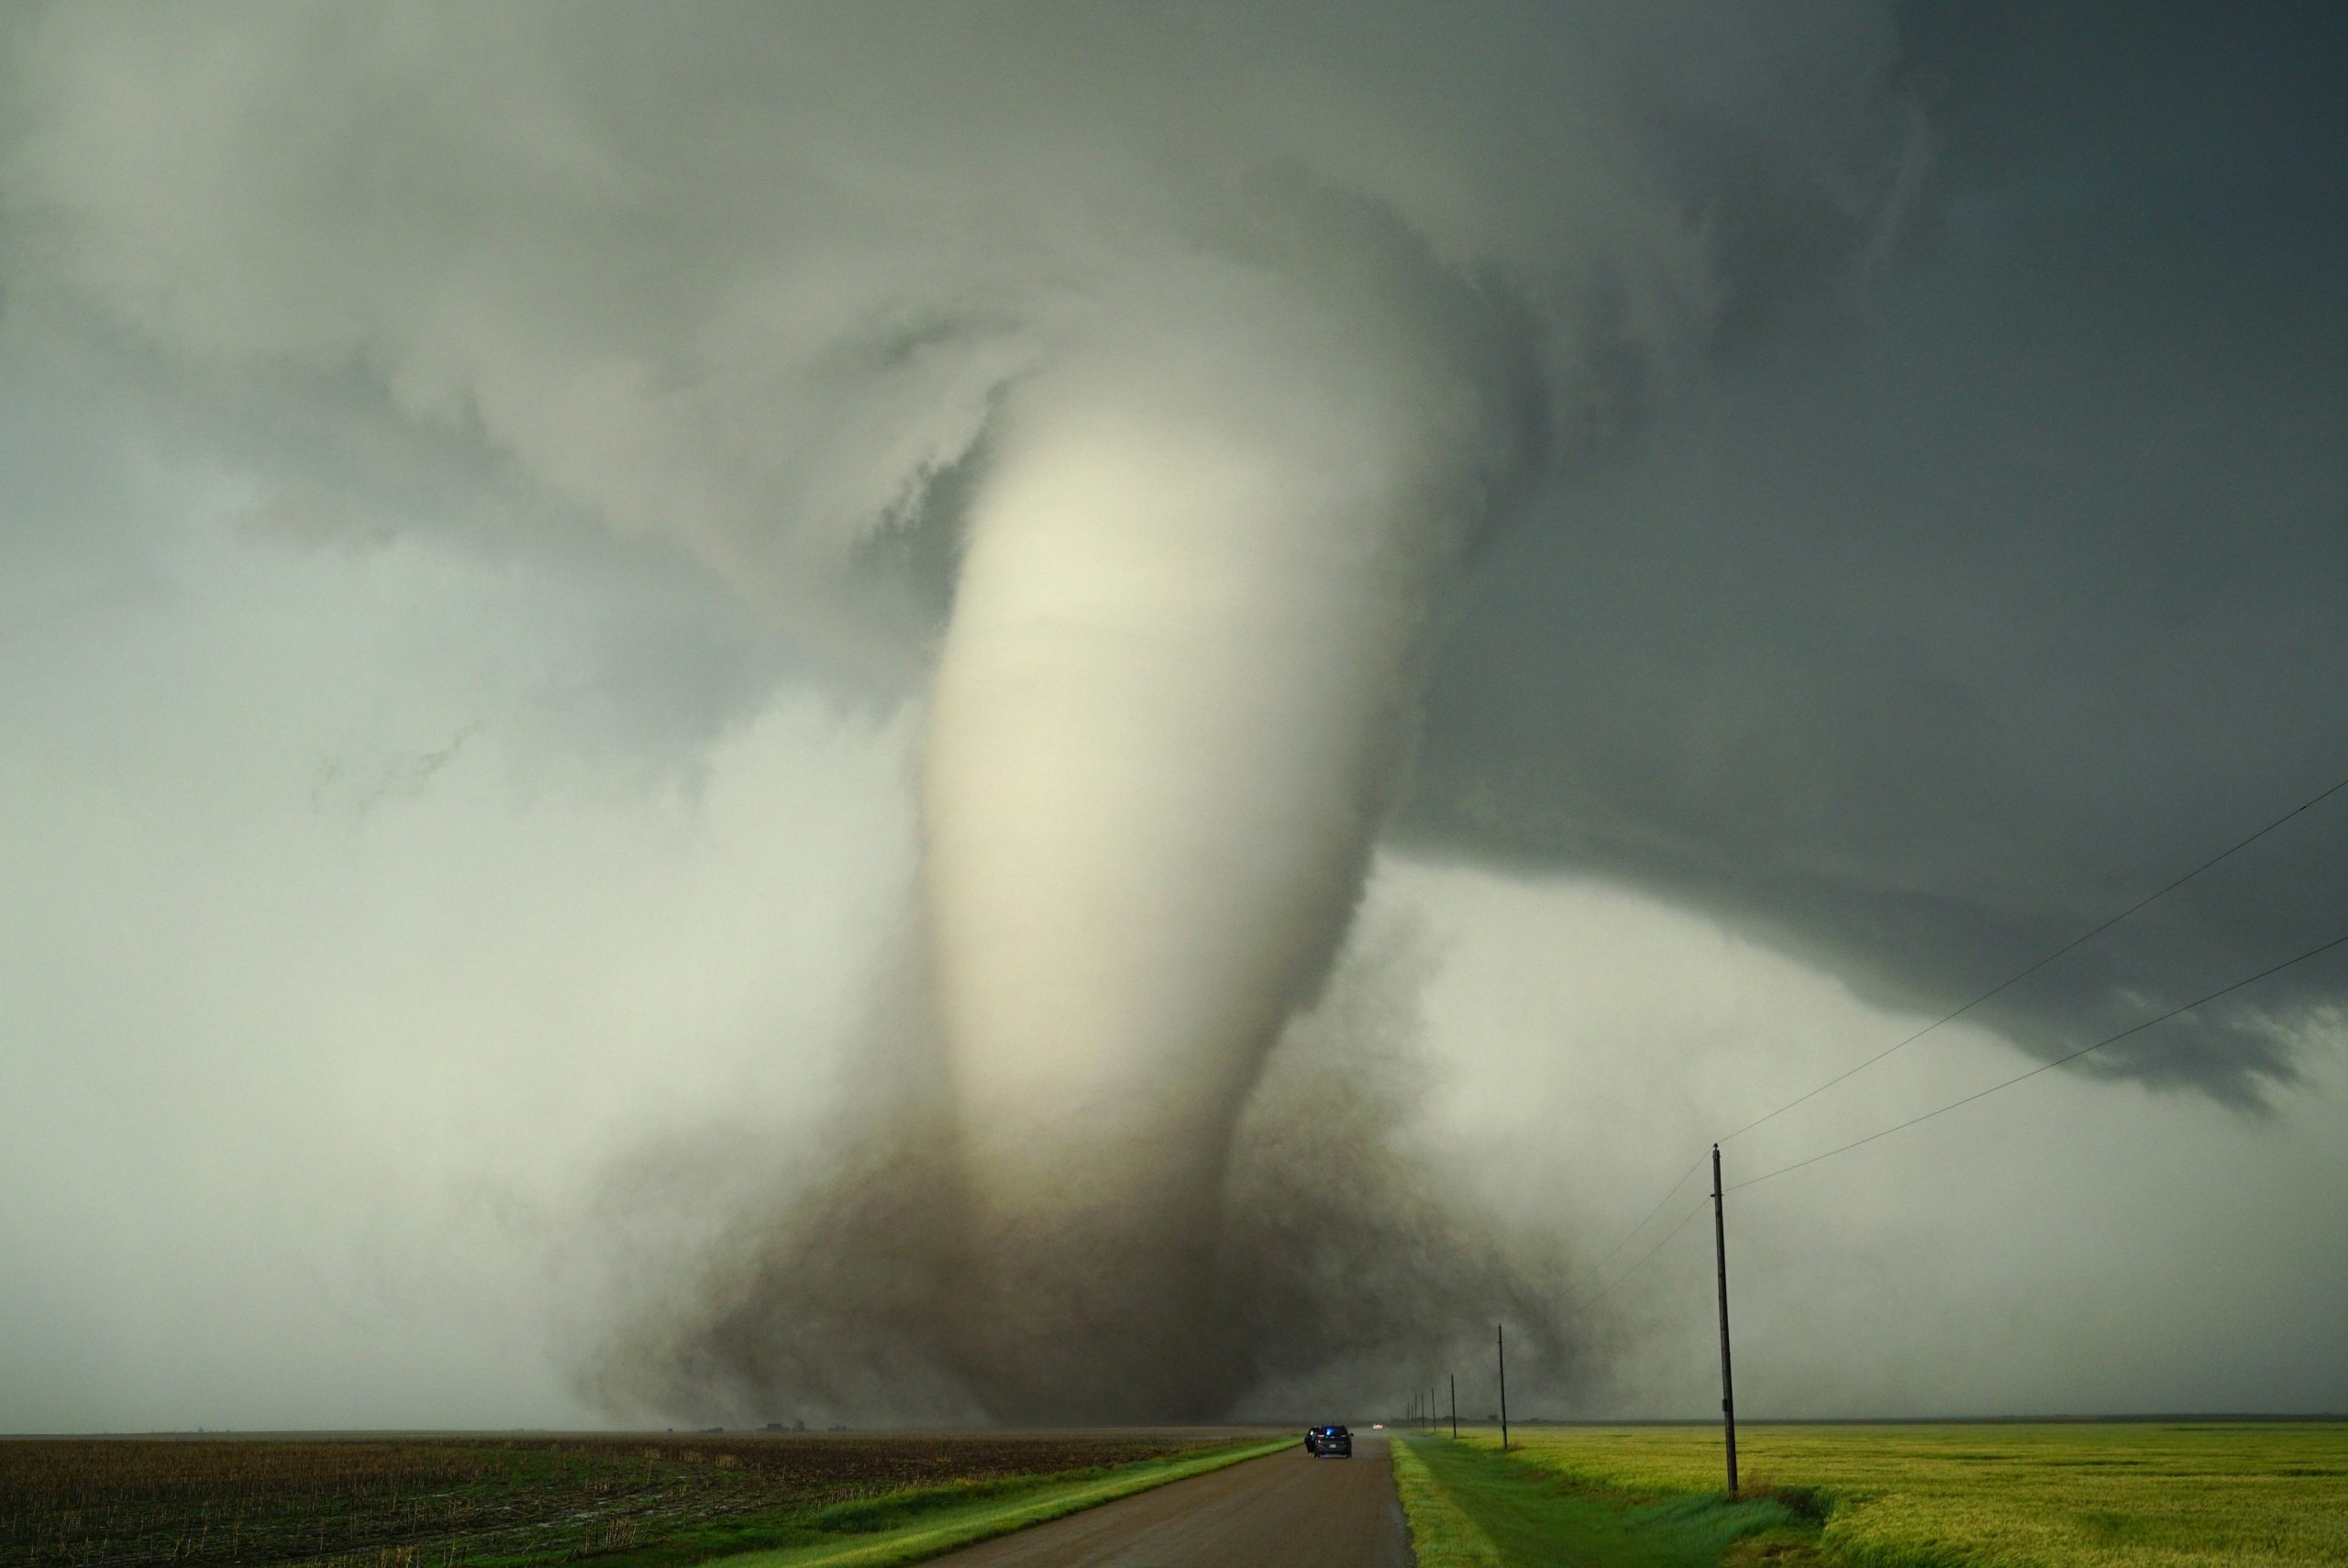
August 2024 Skyview Weather Monthly Newsletter
Feature Article
The F5 Jarrell, Texas Tornado of 1997: A Cataclysmic Event
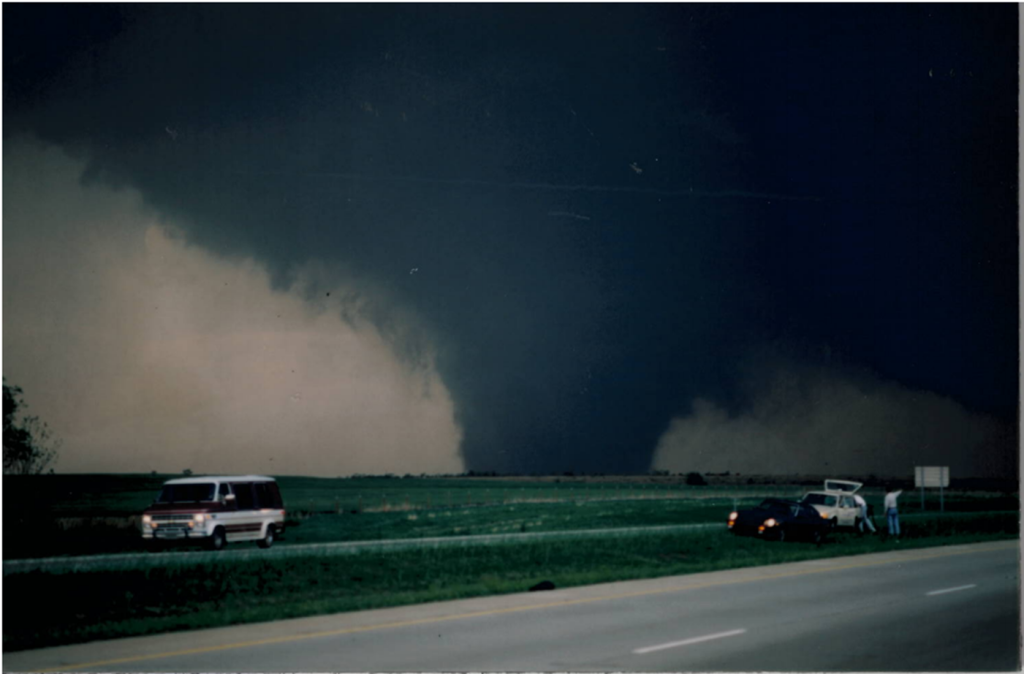
When people think of dangerous tornadoes, their minds often turn to the Moore tornadoes of 1999 and 2013, the Tuscaloosa tornado of 2011, or the Joplin tornado of 2012. However, the Jarrell tornado of 1997 was just as devastating, if not worse, in many respects. This catastrophic event, which took place on May 27, 1997, in Central Texas, produced an F5 tornado that obliterated the Double Creek Estates subdivision in Jarrell, Texas. Known for its extreme destruction, this tornado left an indelible mark on the region and on the field of meteorology.
Event Summary
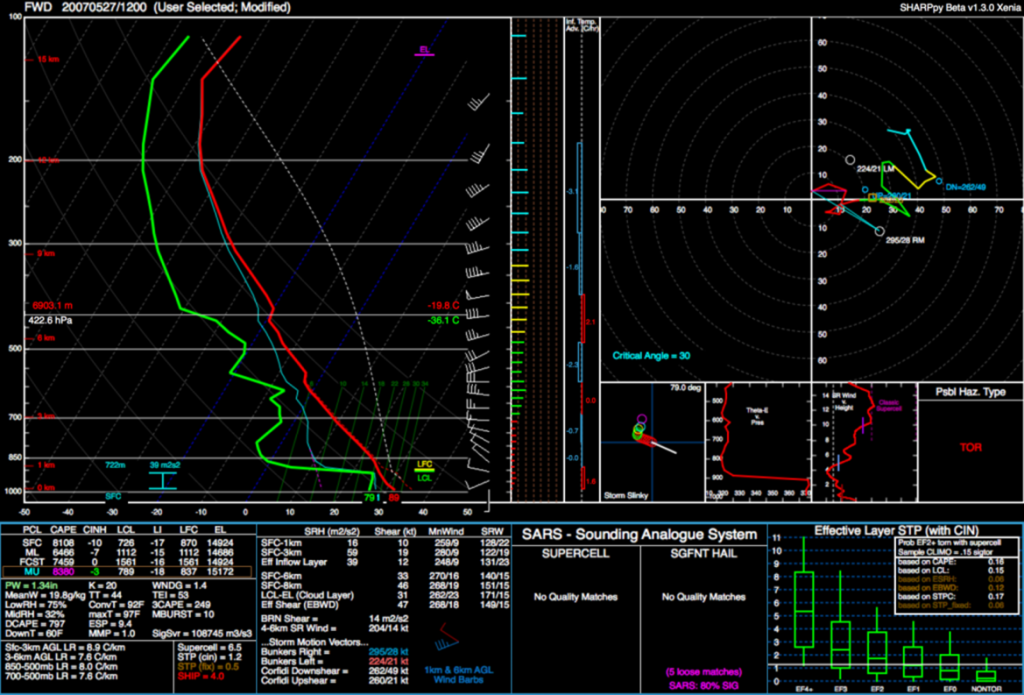
The severe weather on May 27th was particularly notable for the sheer power of the tornado and the unusual atmospheric conditions under which it developed. Typically, tornadoes of such magnitude are associated with strong upper-level forcing and significant wind shear. However, this setup lacked those elements, featuring generally light winds throughout the troposphere. Despite this, 20 tornadoes touched down across Central Texas within six hours, with the Jarrell tornado being the most destructive.
Atmospheric Conditions and Initiation
On the morning of May 27th, a northward-lifting upper-level low pressure system over Nebraska and South Dakota resulted in weak mid-level flow over Texas, with most large-scale lift displaced far to the north. At the surface, a cold front stretched southwestward from a low near Fayetteville, Arkansas, through Central Texas. This front became a key feature in the development of the thunderstorms.
Around noon, a meso-low and a southwestward-propagating gravity wave, identified through satellite imagery, converged near Waco. This convergence area became the initiation point for the supercell that would eventually spawn the Jarrell tornado. Despite the lack of strong vertical wind shear, the environment was characterized by extremely high instability, with Convective Available Potential Energy (CAPE) values exceeding 6500 J/kg, creating conditions ripe for severe thunderstorm development.
Timeline
12:00 PM – 2:30 PM:
Thunderstorm initiation occurred just before noon near Waco, at the intersection of the cold front and meso-low. By 1:21 PM, as the storm moved southwestward, a Tornado Warning was issued due to rapidly increasing low-level rotation. The first tornado of the day, an F3, touched down near Moody, demonstrating the potential for significant destruction.
2:30 PM – 4:00 PM:
The storm continued to intensify as it moved southwestward. Near 2:30 PM, another tornado developed near Morgan’s Point Resort, causing severe tree damage and destroying several homes. As the supercell moved toward Salado, it produced multiple brief tornadoes, including one near Prairie Dell around 3:00 PM. This particular tornado soon evolved into the catastrophic Jarrell tornado.
The Jarrell Tornado
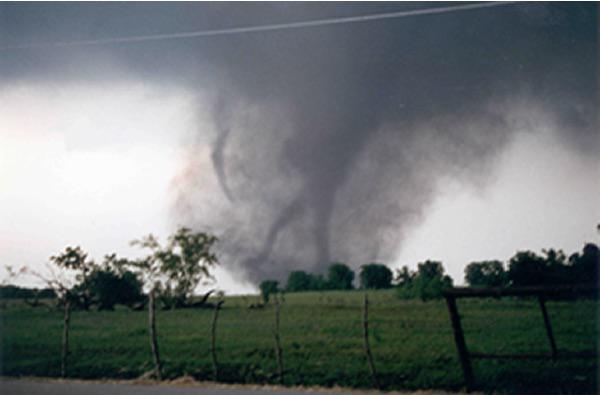
The damage path associated with the Jarrell tornado began in Bell County, about 0.8 miles northwest of the Prairie Dell exit from Interstate 35, near mile marker 280. Initially, the tornado tracked south-southwestward across open country, primarily damaging trees and a few structures. It then crossed the Bell/Williamson County line near where Williamson Road ends and County Road (CR) 304 begins, ripping off approximately 525 feet of asphalt from each of the county roads it crossed. Eyewitnesses reported seeing several small, rope-like funnels before the tornado intensified dramatically into a wider and more powerful vortex.
As the tornado approached Jarrell, it destroyed a business at the intersection of CR 305 and 307 and moved into the Double Creek Estates subdivision, where F5 destruction began. The tornado widened to a maximum width of three-quarters of a mile, scouring the earth and leaving a path of total annihilation. Approximately 40 structures in the Double Creek area were completely destroyed, and 27 people lost their lives. The distinct lack of large debris and the pulverized nature of the remaining materials highlighted the tornado’s incredible strength.
After devastating Double Creek Estates, the tornado crossed CR 309 and moved into a heavily wooded area of cedar trees. The path of total destruction ended abruptly, although a small swath of tree damage on the north side suggested the possibility of a multiple vortex pattern. However, no definitive evidence of multiple vortices was observed.
Analysis and Aftermath
The Jarrell tornado was an anomaly in many respects. Despite the lack of typical tornado-producing conditions such as strong upper-level winds and significant wind shear, the extreme instability in the atmosphere provided sufficient energy for the development of this historic tornado. The event underscored the importance of understanding and forecasting severe weather in less-than-ideal scenarios.
The aftermath of the Jarrell tornado was a sobering reminder of nature’s unparalleled power. The National Weather Service (NWS) conducted extensive surveys and studies to understand the factors leading to the tornado’s formation and its unprecedented intensity. These studies have contributed to improved forecasting techniques and a greater appreciation of the complexity of severe weather phenomena.
Conclusion
The F5 Jarrell tornado of 1997 stands as one of the most powerful and devastating tornadoes in recorded history. Its formation under atypical conditions challenges meteorologists to continually refine their understanding of severe weather dynamics. The legacy of this event is a testament to the resilience of the affected communities and the ongoing efforts to enhance weather prediction and public safety.
Colorado Drought Update
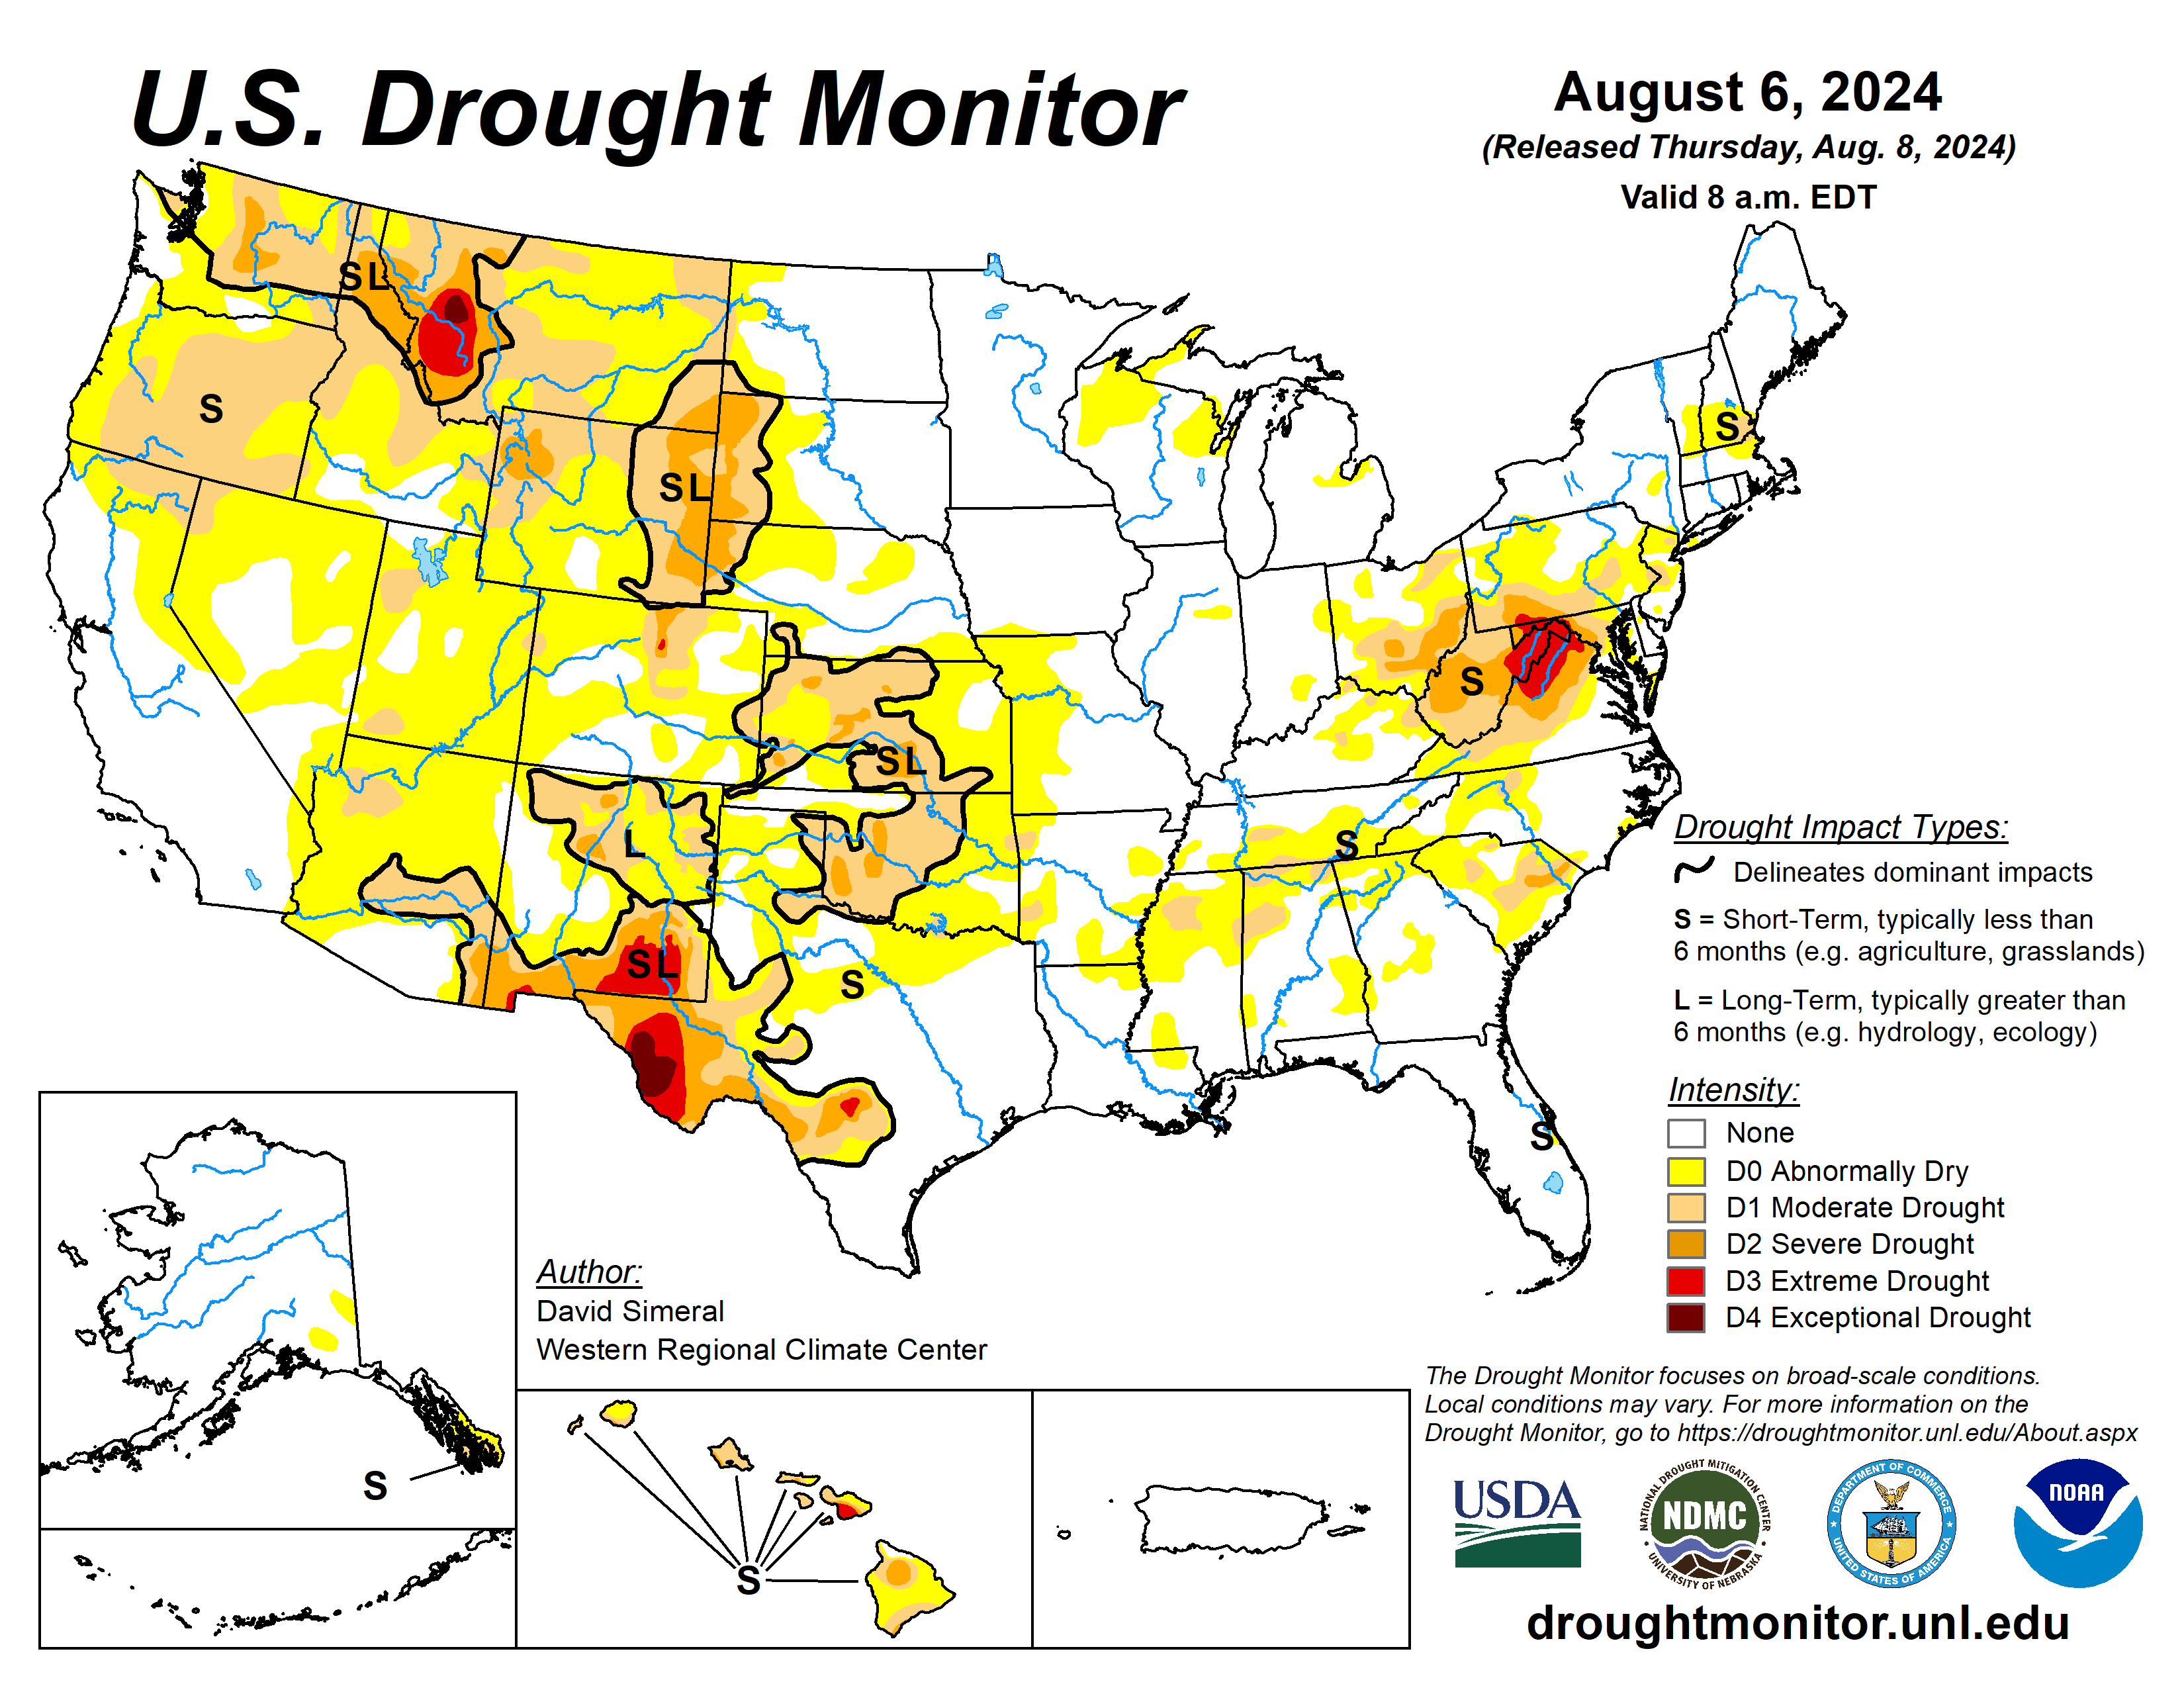
In July 2024, the U.S. experienced significant drought conditions, particularly in the Southwest and Plains regions. The Southwest faced extreme heat, with temperatures reaching up to 120°F in Death Valley. These hot and dry conditions increased fire potential and led to wildfires across the western US. The southern Plains also experienced above-normal temperatures and missed out on precipitation, resulting in further drying and degradation.
In contrast, the Southeast received substantial rainfall, which improved lingering dryness in the area. However, the Northeast saw deteriorating conditions, with moderate drought introduced in parts of New England.
August 2024 Temperature Anomaly Forecast
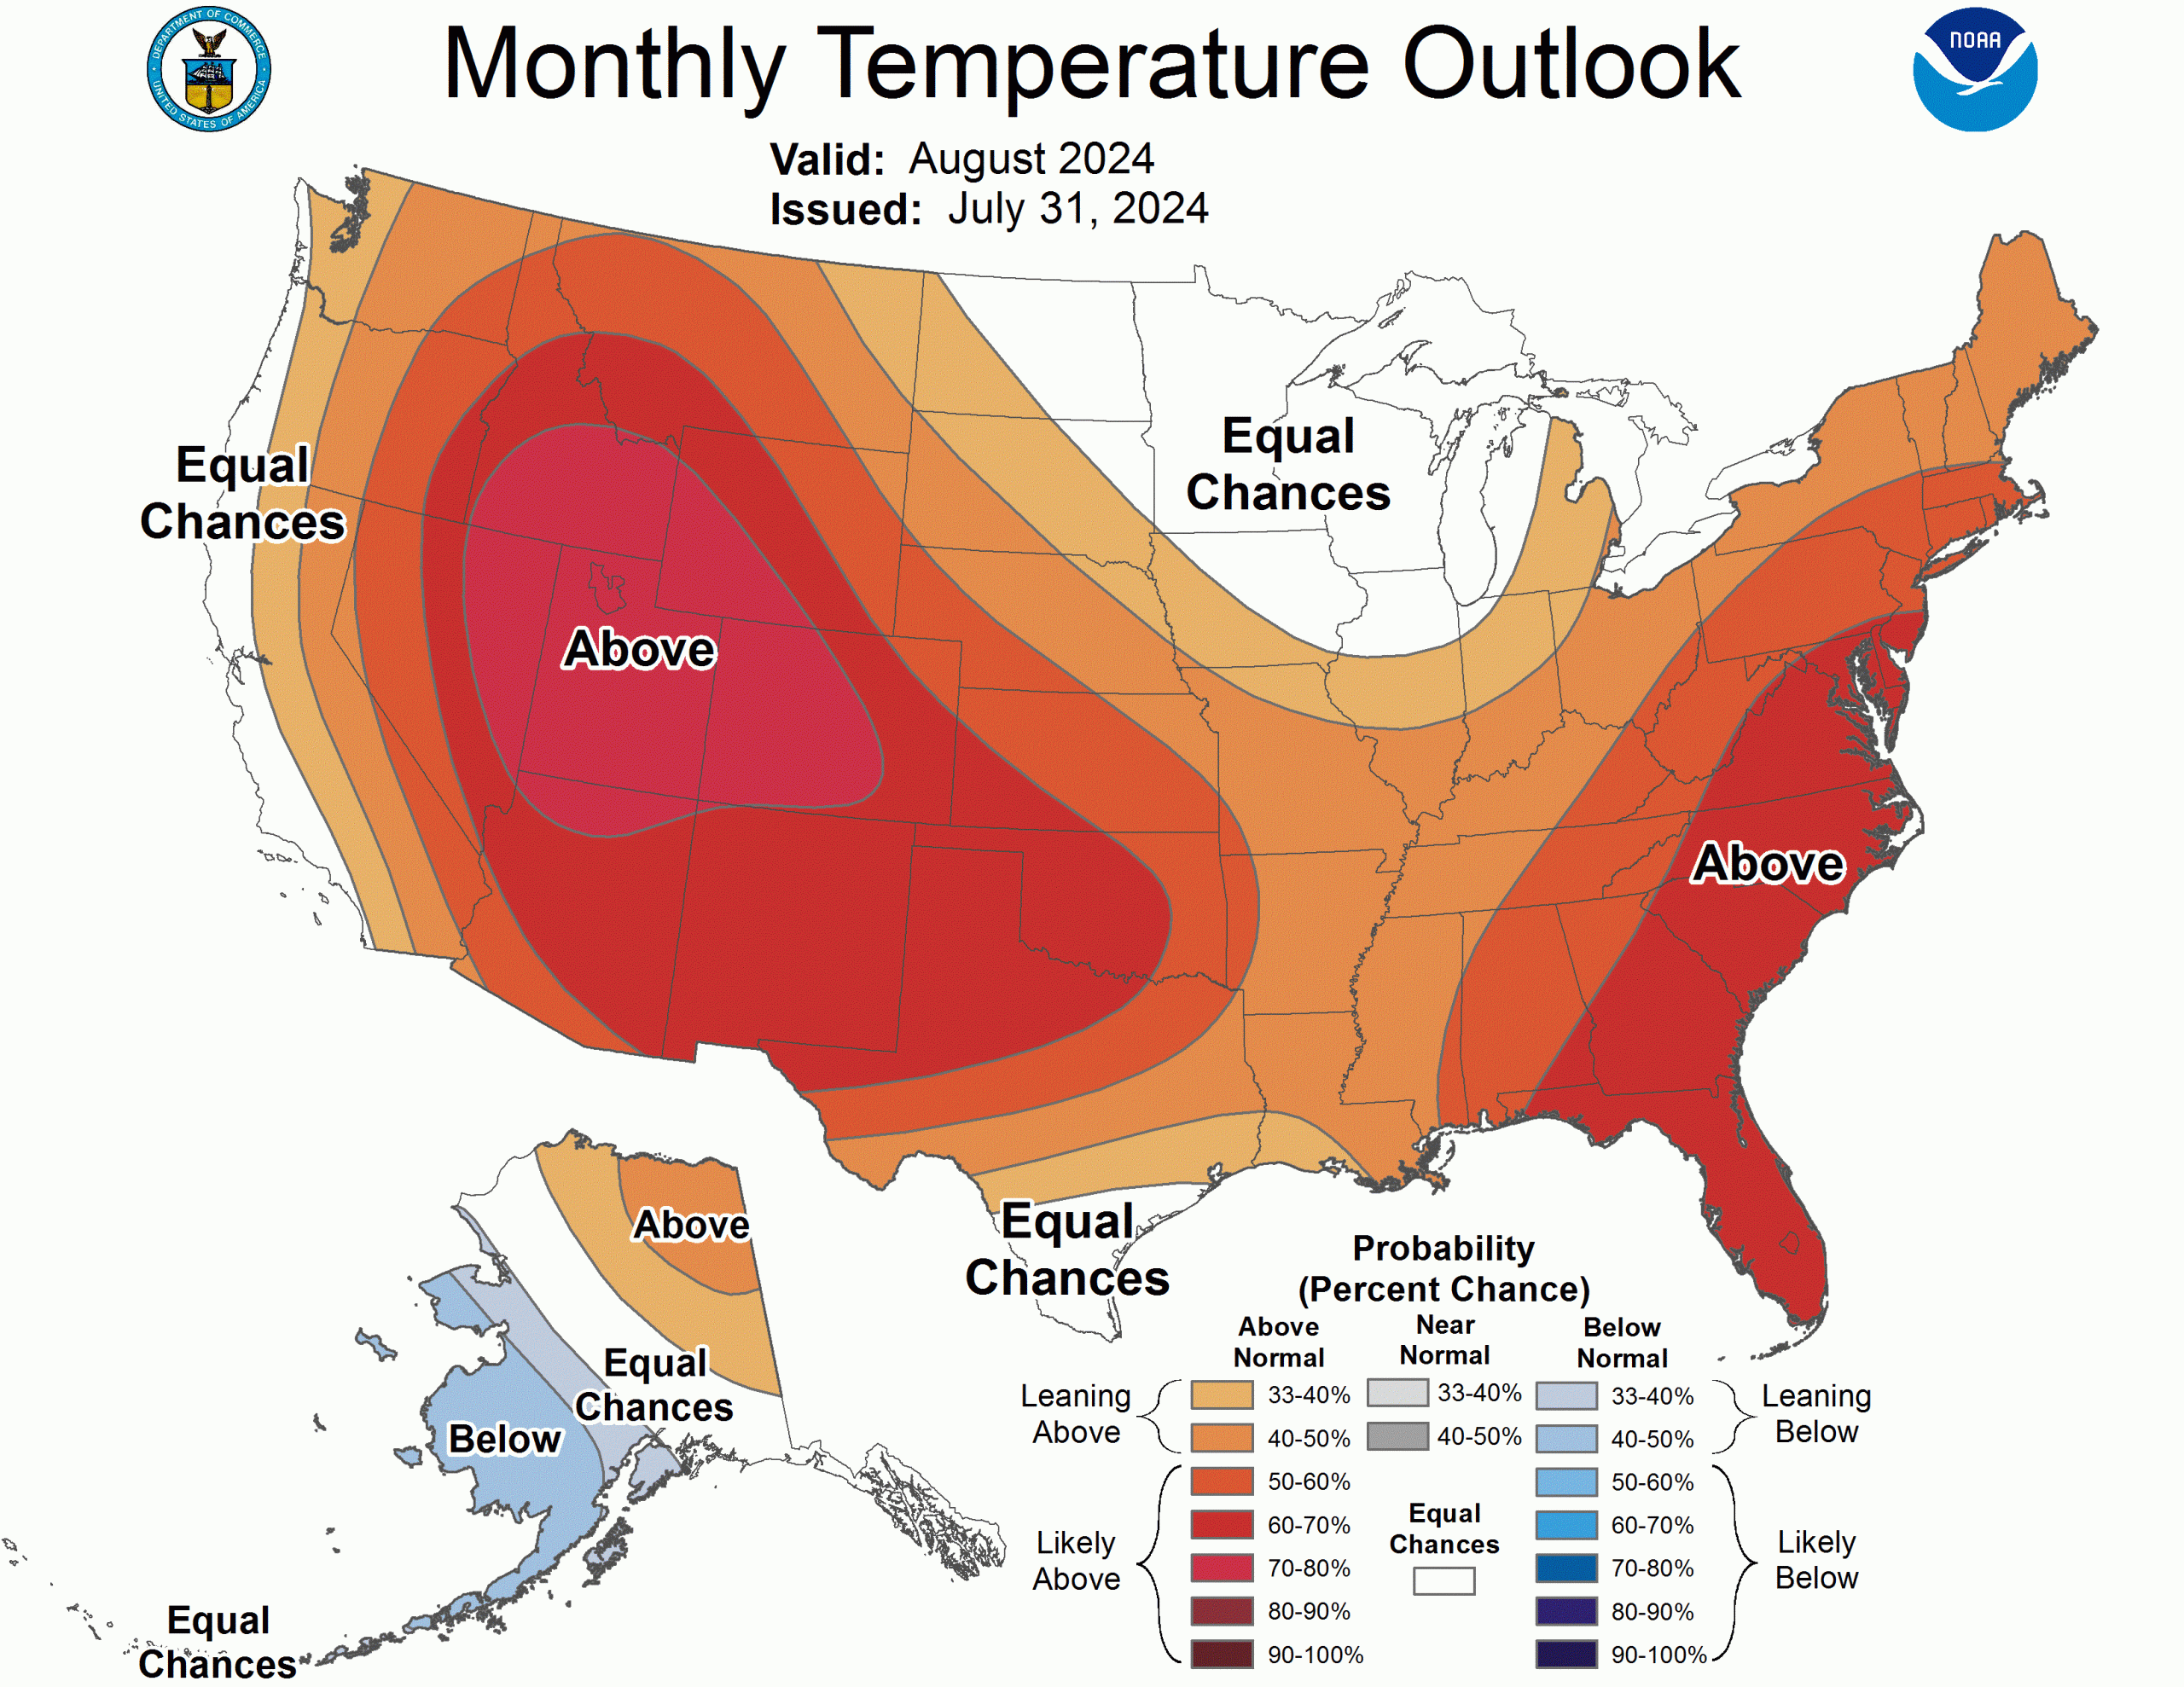
The Climate Prediction Center’s outlook for August 2024 indicates that much of the contiguous United States is expected to experience above-normal temperatures. The strongest probabilities for above-average temperatures are forecasted for the Interior West and New England, with probabilities reaching 60-70%. This outlook suggests a continuation of the warmer-than-average conditions seen in previous months, with no significant areas expected to experience below-normal temperatures.
August 2024 Precipitation Anomaly Forecast
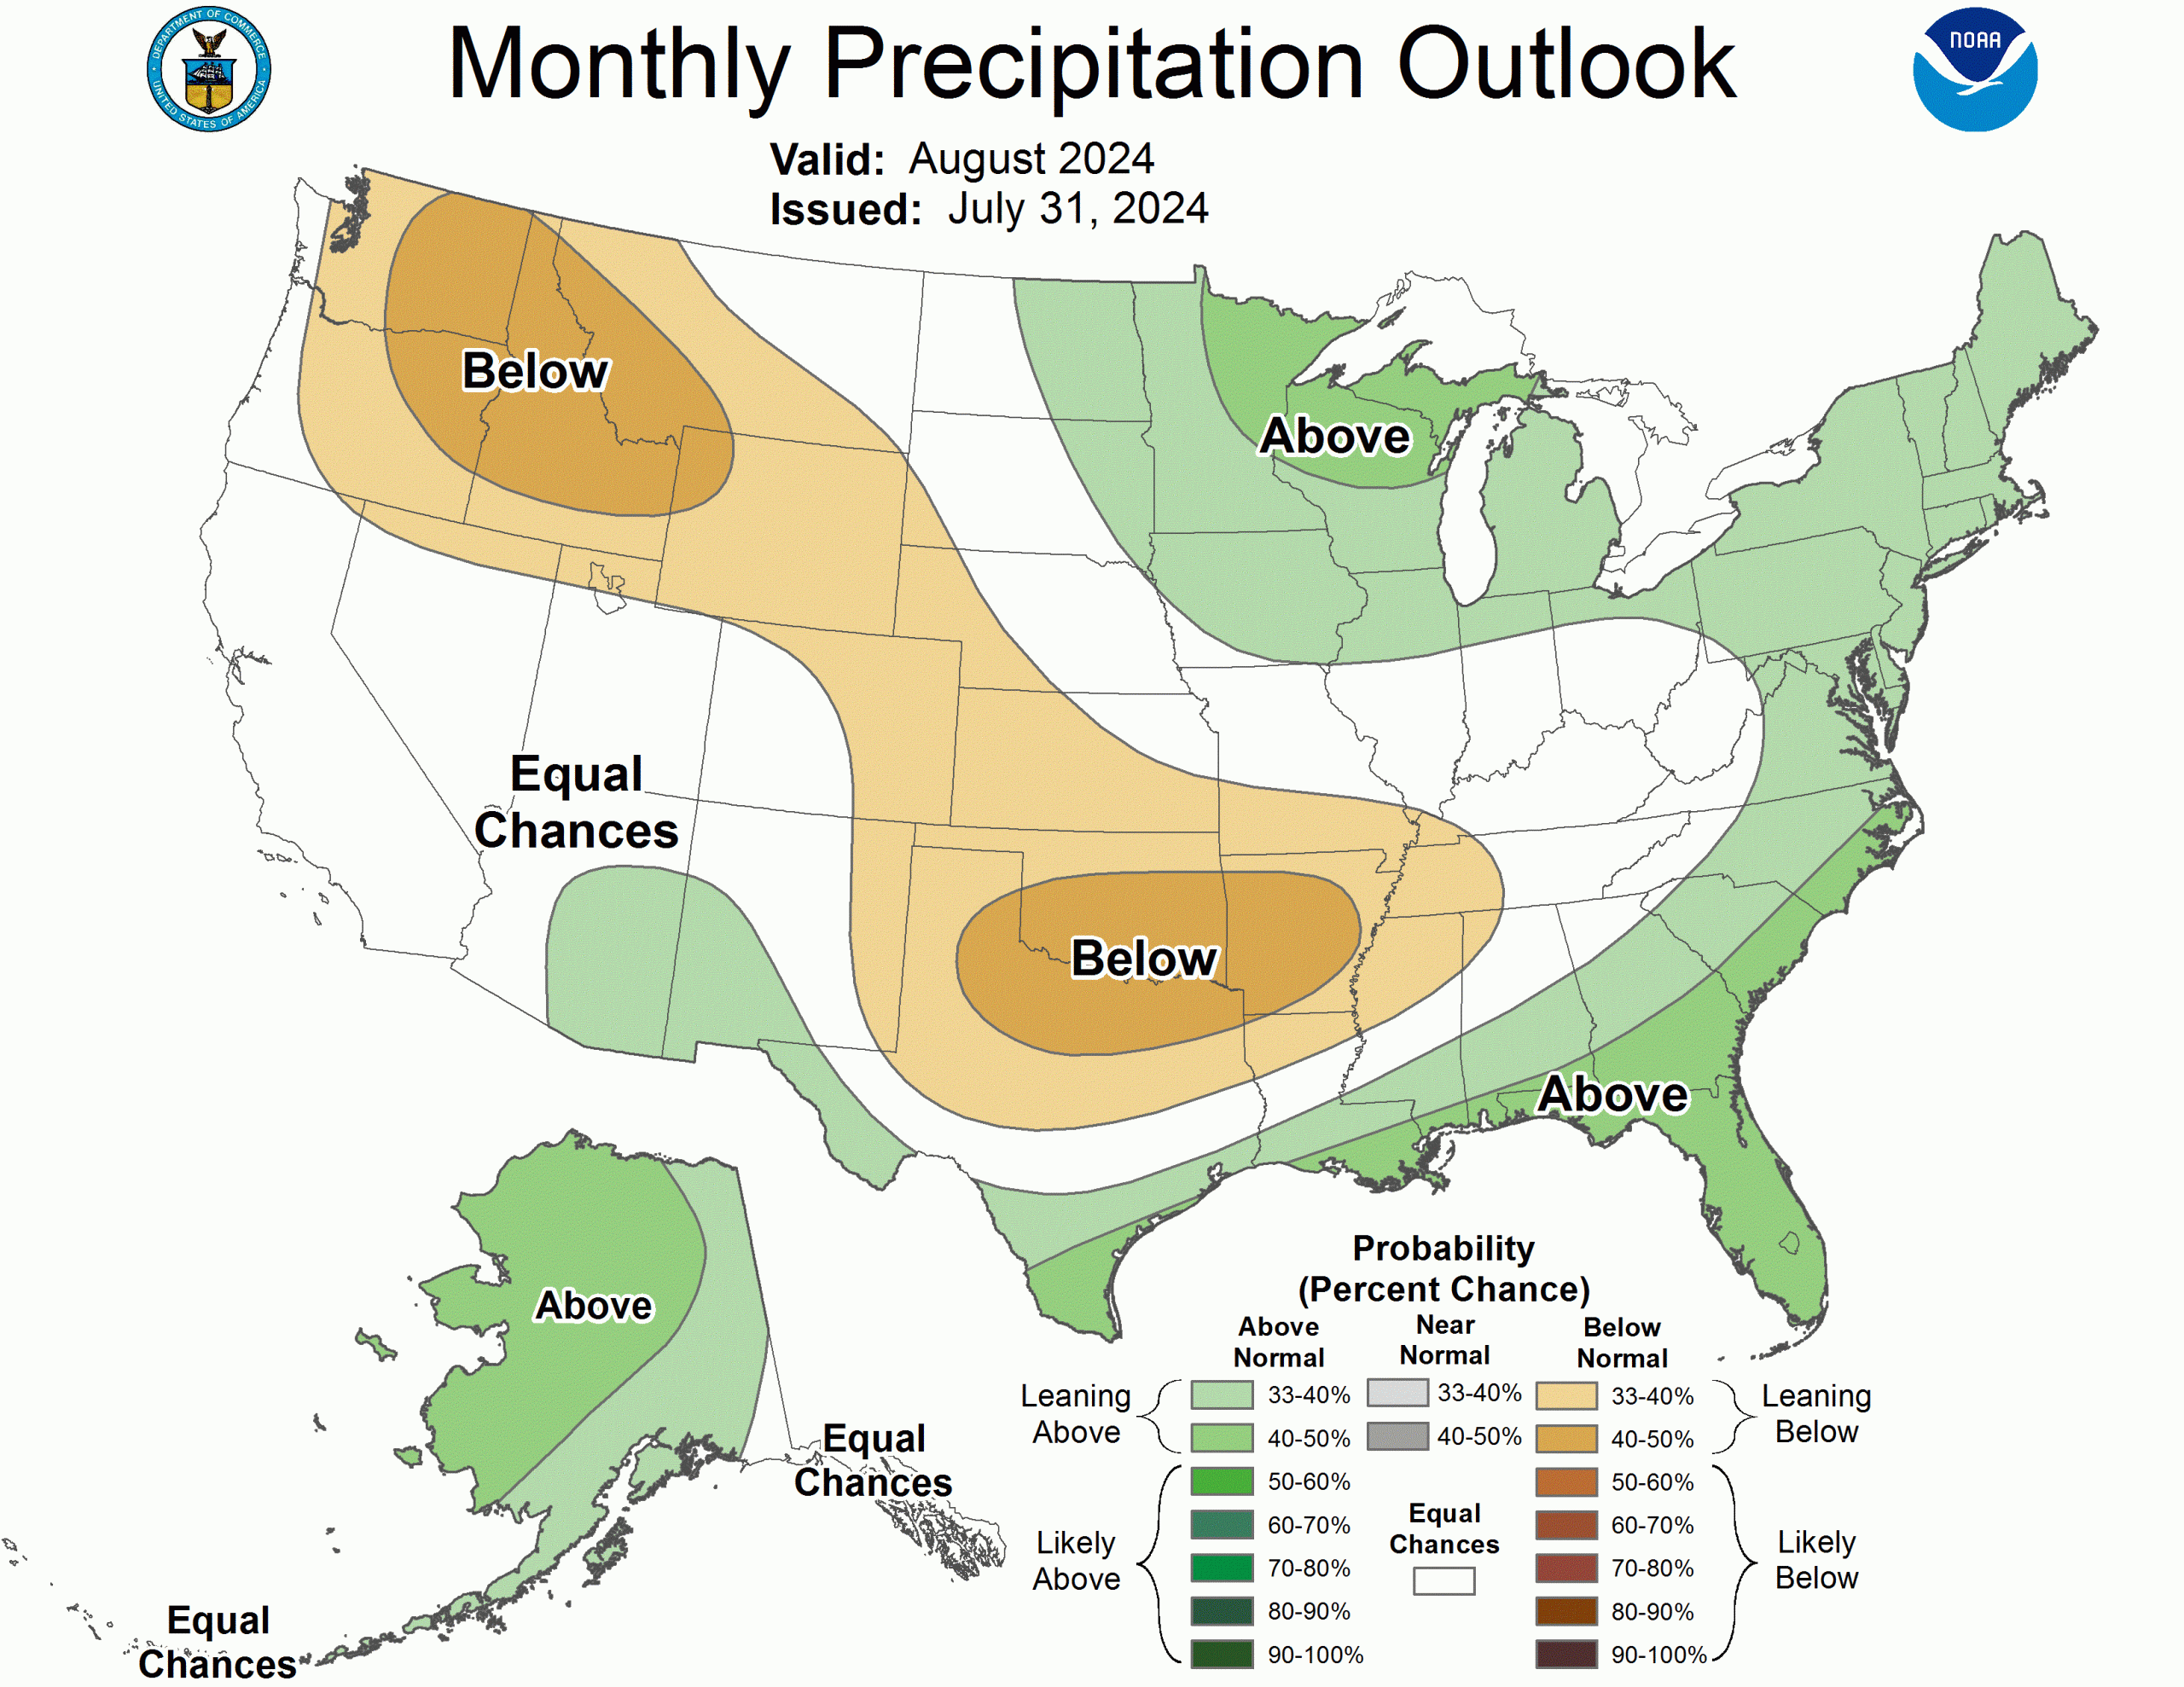
The Climate Prediction Center’s outlook for August 2024 indicates a mixed pattern of precipitation anomalies across the United States. The forecast suggests above-normal precipitation for the eastern Dakotas, Upper Mississippi Valley, Great Lakes region, Atlantic coast states, Gulf Coast area, southern Texas, and the Four Corners region. Conversely, below-normal precipitation is expected in the Pacific Northwest and the south-central Plains. This outlook reflects the ongoing variability in weather patterns, with some regions likely to experience wetter conditions while others may face drier-than-average weather.
Weather Summary for Colorado, July 2024
The arrival of a few strong couple strong cold fronts brought just a few days of relief from what ended up being a rather miserably hot and dry July. 20 of July’s 31 days broke the 90-degree threshold, with 3 of those 20 eclipsing the triple-digit mark at DIA. A ridge of high pressure remained consistent in its placement over the desert southwest, occasionally shifting in and out of the state over the course of the month. During the second week of July, it shifted almost directly over Colorado, and left two consecutive triple-digit days in its wake, followed by another day where DIA peaked at 99°F.
The typical Front Range monsoonal moisture transport setup involves this high-pressure ridge shifting to the southeast of Colorado, opening the door for tropical moisture from both the Gulf of Mexico and Bay of California to arrive in eastern Colorado. After the passage of the mid-July heatwave, this is exactly what happened, and moisture was available for the third week of July. However, a weak jet stream overhead, a result of the transition from El Nino to La Nina, minimized the availability of energy for thunderstorm organization throughout the majority of the month. Afternoon thunderstorms developed most days after this heatwave passed, but many remained dry under consistent high temperatures, leading to gusty outflows from rain evaporating before it hit the ground. July 20th was the exception, as a severe thunderstorm developed along the Cheyenne Ridge and traveled directly south along the I-25 corridor. This storm, along with others spawned by its outflow, delivered the highest measured daily precipitation at DIA, a total of 0.67”. Areas south of the Palmer Divide like Colorado Springs and Pueblo received closer to normal amounts of precipitation, but still below average.
At the end of July, the overall pattern dried out once again. This allowed for what could have developed into disaster if not for the efforts of Colorado’s excellent first responders. A few days of wildfire smoke in the air, transported from fires in California, Oregon, and Idaho, served as an omen of what was to come for the Front Range. The first of 4 fires within 45 miles of Denver started late in the morning of July 29th, and was soon coined the Alexander Mountain Fire. This fire ended up being the largest, and was located in the foothills adjacent to Highway 34 west of Loveland. The following day, two more fires began, each closer to Denver. The Stone Canyon fire, near Lyons and north of Boulder, would end up being the only fire to claim a life. The Quarry Fire was the closest to downtown, in central Jefferson County, and posed unique challenges to firefighters due to complex terrain and an active rattlesnake environment. The last fire, near the Gross Reservoir in Boulder County, was quickly contained after its start on July 31st.
Weather Statistics for Denver International Airport (DIA), July 2024
DIA Temperature (°F), July 2024
| Observed Value | Normal Value | Departure From Normal | |
| Average Max | 91.7°F | 89.9°F | 1.8°F |
| Average Min | 59.6°F | 60.2°F | -0.6°F |
| Monthly Mean | 75.7°F | 75.2°F | 0.6°F |
| Days With Max 90 Or Above | 20 | 18.8 | 1.2 |
| Days With Max 32 Or Below | 0 | 0 | 0 |
| Days With Min 32 Or Below | 0 | 2.9 | 2.9 |
| Days With Min 0 Or Below | 0 | 0 | 0 |
| Highest | 102°F on 7/12 | 99 | 2 |
| Lowest | 52° on 7/05 | 51 | 1 |
DIA Liquid Precipitation (Inches), July 2024
| Observed Value | Date(s) | Normal Value | Departure From Normal | |
| Monthly Total | 1.10” | 2.14” | -1.04” | |
| Yearly Total | 12.73” | 9.57” | 3.16” | |
| Greatest In 24 Hours | 0.67” | 07/20 | ||
| Days With Measurable Precip. | 7 | 8.3 | -1.3 |
2024 Rainfall Accumulation for the Colorado Eastern Plains
| City | May | June | July | Aug | Sept | Total |
| Aurora (Central) | 1.17 | 0.29 | 0.74 | 2.20 | ||
| Boulder | 0.26 | 0.35 | 0.50 | 1.11 | ||
| Brighton | 0.57 | 0.41 | 1.04 | 2.02 | ||
| Broomfield | 0.77 | 0.35 | 0.94 | 2.06 | ||
| Castle Rock | 1.59 | 1.65 | 2.28 | 5.52 | ||
| Colo Sprgs Airport | 0.82 | 0.51 | 2.06 | 3.39 | ||
| Denver DIA | 1.70 | 0.36 | 1.10 | 3.16 | ||
| Denver Downtown | 1.21 | 0.07 | 2.05 | 3.33 | ||
| Golden | 0.98 | 0.58 | 0.91 | 2.47 | ||
| Fort Collins | 0.93 | 0.51 | 1.34 | 2.78 | ||
| Highlands Ranch | 1.81 | 0.52 | 0.74 | 3.07 | ||
| Lakewood | 1.03 | 0.74 | 1.26 | 3.03 | ||
| Littleton | 1.39 | 0.38 | 0.50 | 2.27 | ||
| Monument | 1.79 | 0.50 | 2.01 | 4.30 | ||
| Parker | 1.63 | 1.01 | 1.10 | 3.74 | ||
| Sedalia – Hwy 67 | 1.94 | 1.03 | 0.94 | 3.91 | ||
| Thornton | 0.37 | 0.28 | 1.20 | 1.85 | ||
| Westminster | 0.65 | 0.47 | 0.91 | 2.03 | ||
| Wheat Ridge | 0.75 | 0.42 | 0.98 | 2.15 | ||
| Windsor | 0.94 | 1.36 | 0.93 | 3.23 |
August 2024 Preview
On average, the four wettest months of the year in Denver are April, May, June, and July, with August being the driest month of the summer. This drying trend comes with a minimal decrease in temperature from July, the hottest month of the year. The combination of drying out and continued heat gives Colorado’s August its “dog days of summer” feel.
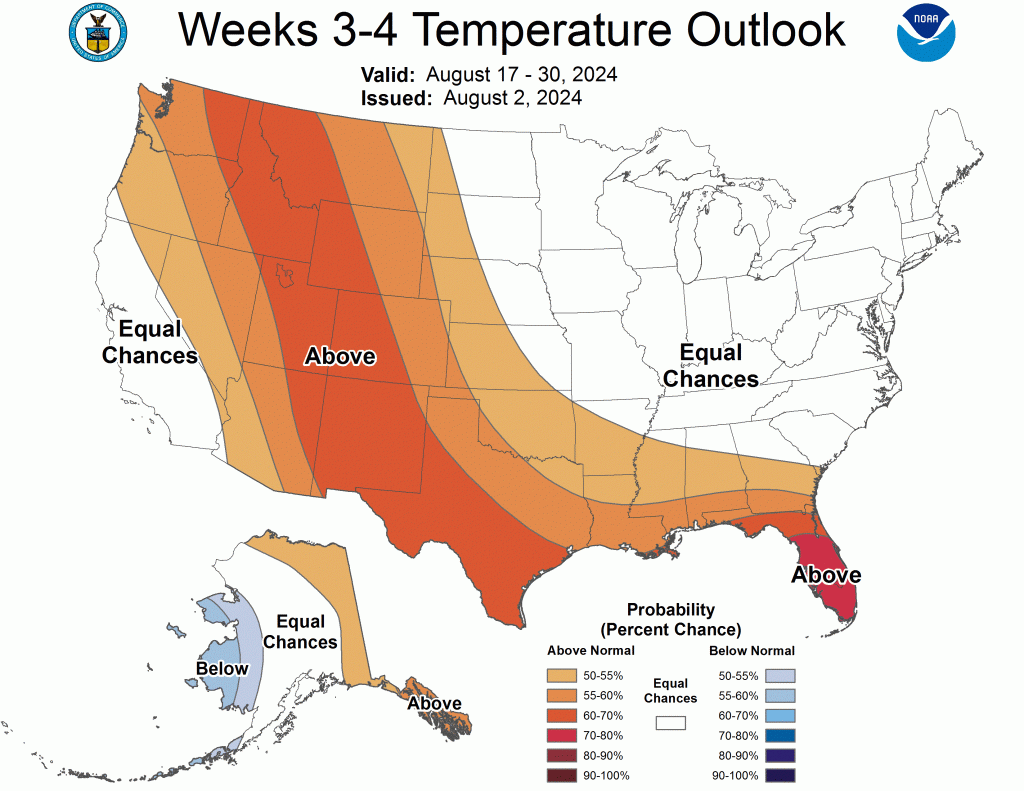
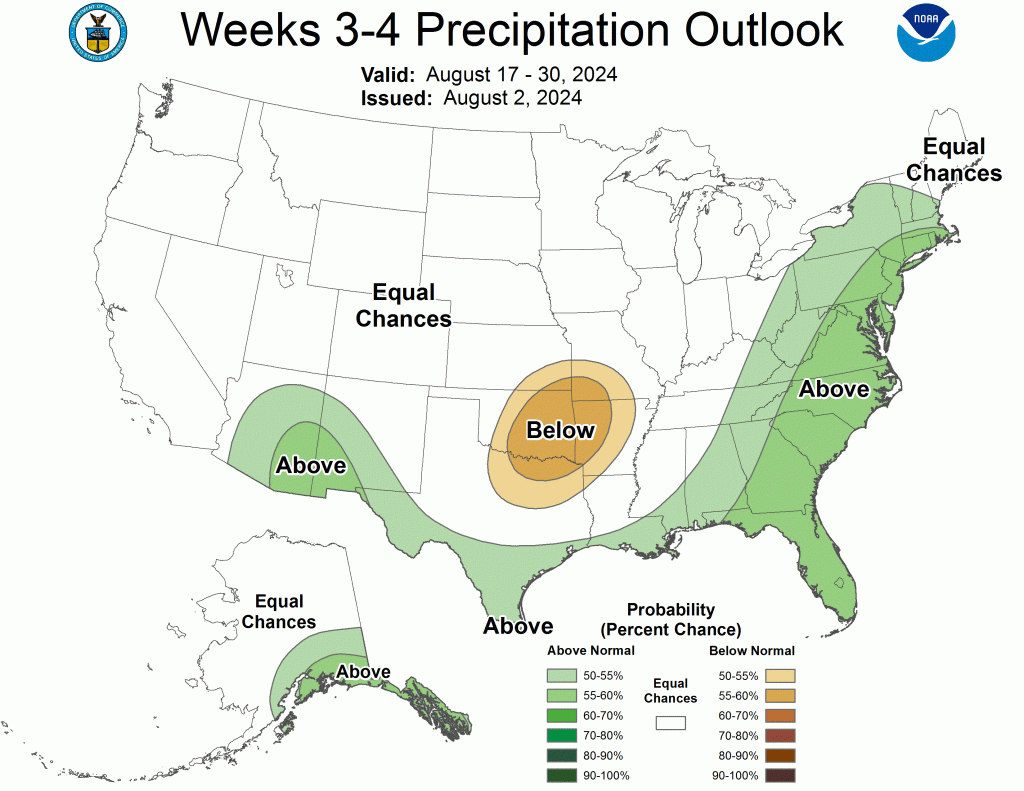
Both the mid-range forecast models and the long-term climate models agree that this August will be relatively normal for temperature (perhaps slightly above), but below average for precipitation. Considering that the monsoonal setup is present currently, in the very beginning of August’s second week, it’s reasonable to assume that those dog days will arrive as they do each year, and will be brutal. The current monsoonal setup will continue to deliver moisture to the state through the middle of the month, but a there will be a return to daily highs around 90° as moisture decreases continually until September arrives.
August Climatology for Denver
(Normal Period 1991-2020 Dia Data)
Temperature
| AVERAGE HIGH | 87.5°F |
| AVERAGE LOW | 58.3°F |
| MONTHLY MEAN | 72.9°F |
| DAYS WITH HIGH 90 OR ABOVE | 13.8 |
| DAYS WITH HIGH 32 OR BELOW | 0 |
| DAYS WITH LOW 32 OR BELOW | 0 |
| DAYS WITH LOWS ZERO OR BELOW | 0 |
Precipitation
| MONTHLY MEAN | 1.58” |
| DAYS WITH MEASURABLE PRECIPITATION | 7.5 |
| AVERAGE SNOWFALL IN INCHES | 0.0” |
| DAYS WITH 1.0 INCH OF SNOW OR MORE | 0 |
Miscellaneous Averages
| HEATING DEGREE DAYS | 9 |
| COOLING DEGREE DAYS | 254 |
| WIND SPEED (MPH) | 9.8 mph |
| WIND DIRECTION | South |
| DAYS WITH THUNDERSTORMS | 13 |
| DAYS WITH DENSE FOG | 1 |
| PERCENT OF SUNSHINE POSSIBLE | 69% |
Extremes
| RECORD HIGH | 105 on 8/08/1878 |
| RECORD LOW | 40 on 8/24-8/26 1910 |
| WARMEST | 77.0 in 2011 |
| COLDEST | 66.5 in 1915 |
| WETTEST | 5.85” in 1979 |
| DRIEST | 0.02” in 1924 |
| SNOWIEST | 0.0” |
| LEAST SNOWY | 0.0” |
The Skyview Weather Newsletter is a monthly publication that aims to provide readers with engaging and informative content about meteorological science. Each issue features articles thoughtfully composed by Skyview’s team of meteorologists, covering a wide range of topics from the birth of Doppler Radar to the impact of weather phenomena. The newsletter serves as a platform to share the latest advancements in weather forecasting technology and the science behind it, enhancing our understanding of weather.
Skyview Weather has been a pillar for reliable weather services for over 30 years, providing unparalleled forecasts and operations across the Continental US. We offer a comprehensive suite of services that range from live weather support to detailed forecasts, extensive weather data collection, and weather reporting. Our clients, ranging from concert venues to golf courses, theme parks to hotels, schools to police departments, and more, rely on Skyview Weather for winter and summer weather alerts, now available on the Skyview Weather mobile app. These alerts cover a broad spectrum of weather conditions, including snow, lightning, hail, tornadoes, severe weather, and heavy rain. Learn more about how Skyview Weather products and services can support your organization through severe, winter, flood, and fire weather.
