July 2024 Skyview Weather Monthly Newsletter
Feature Article
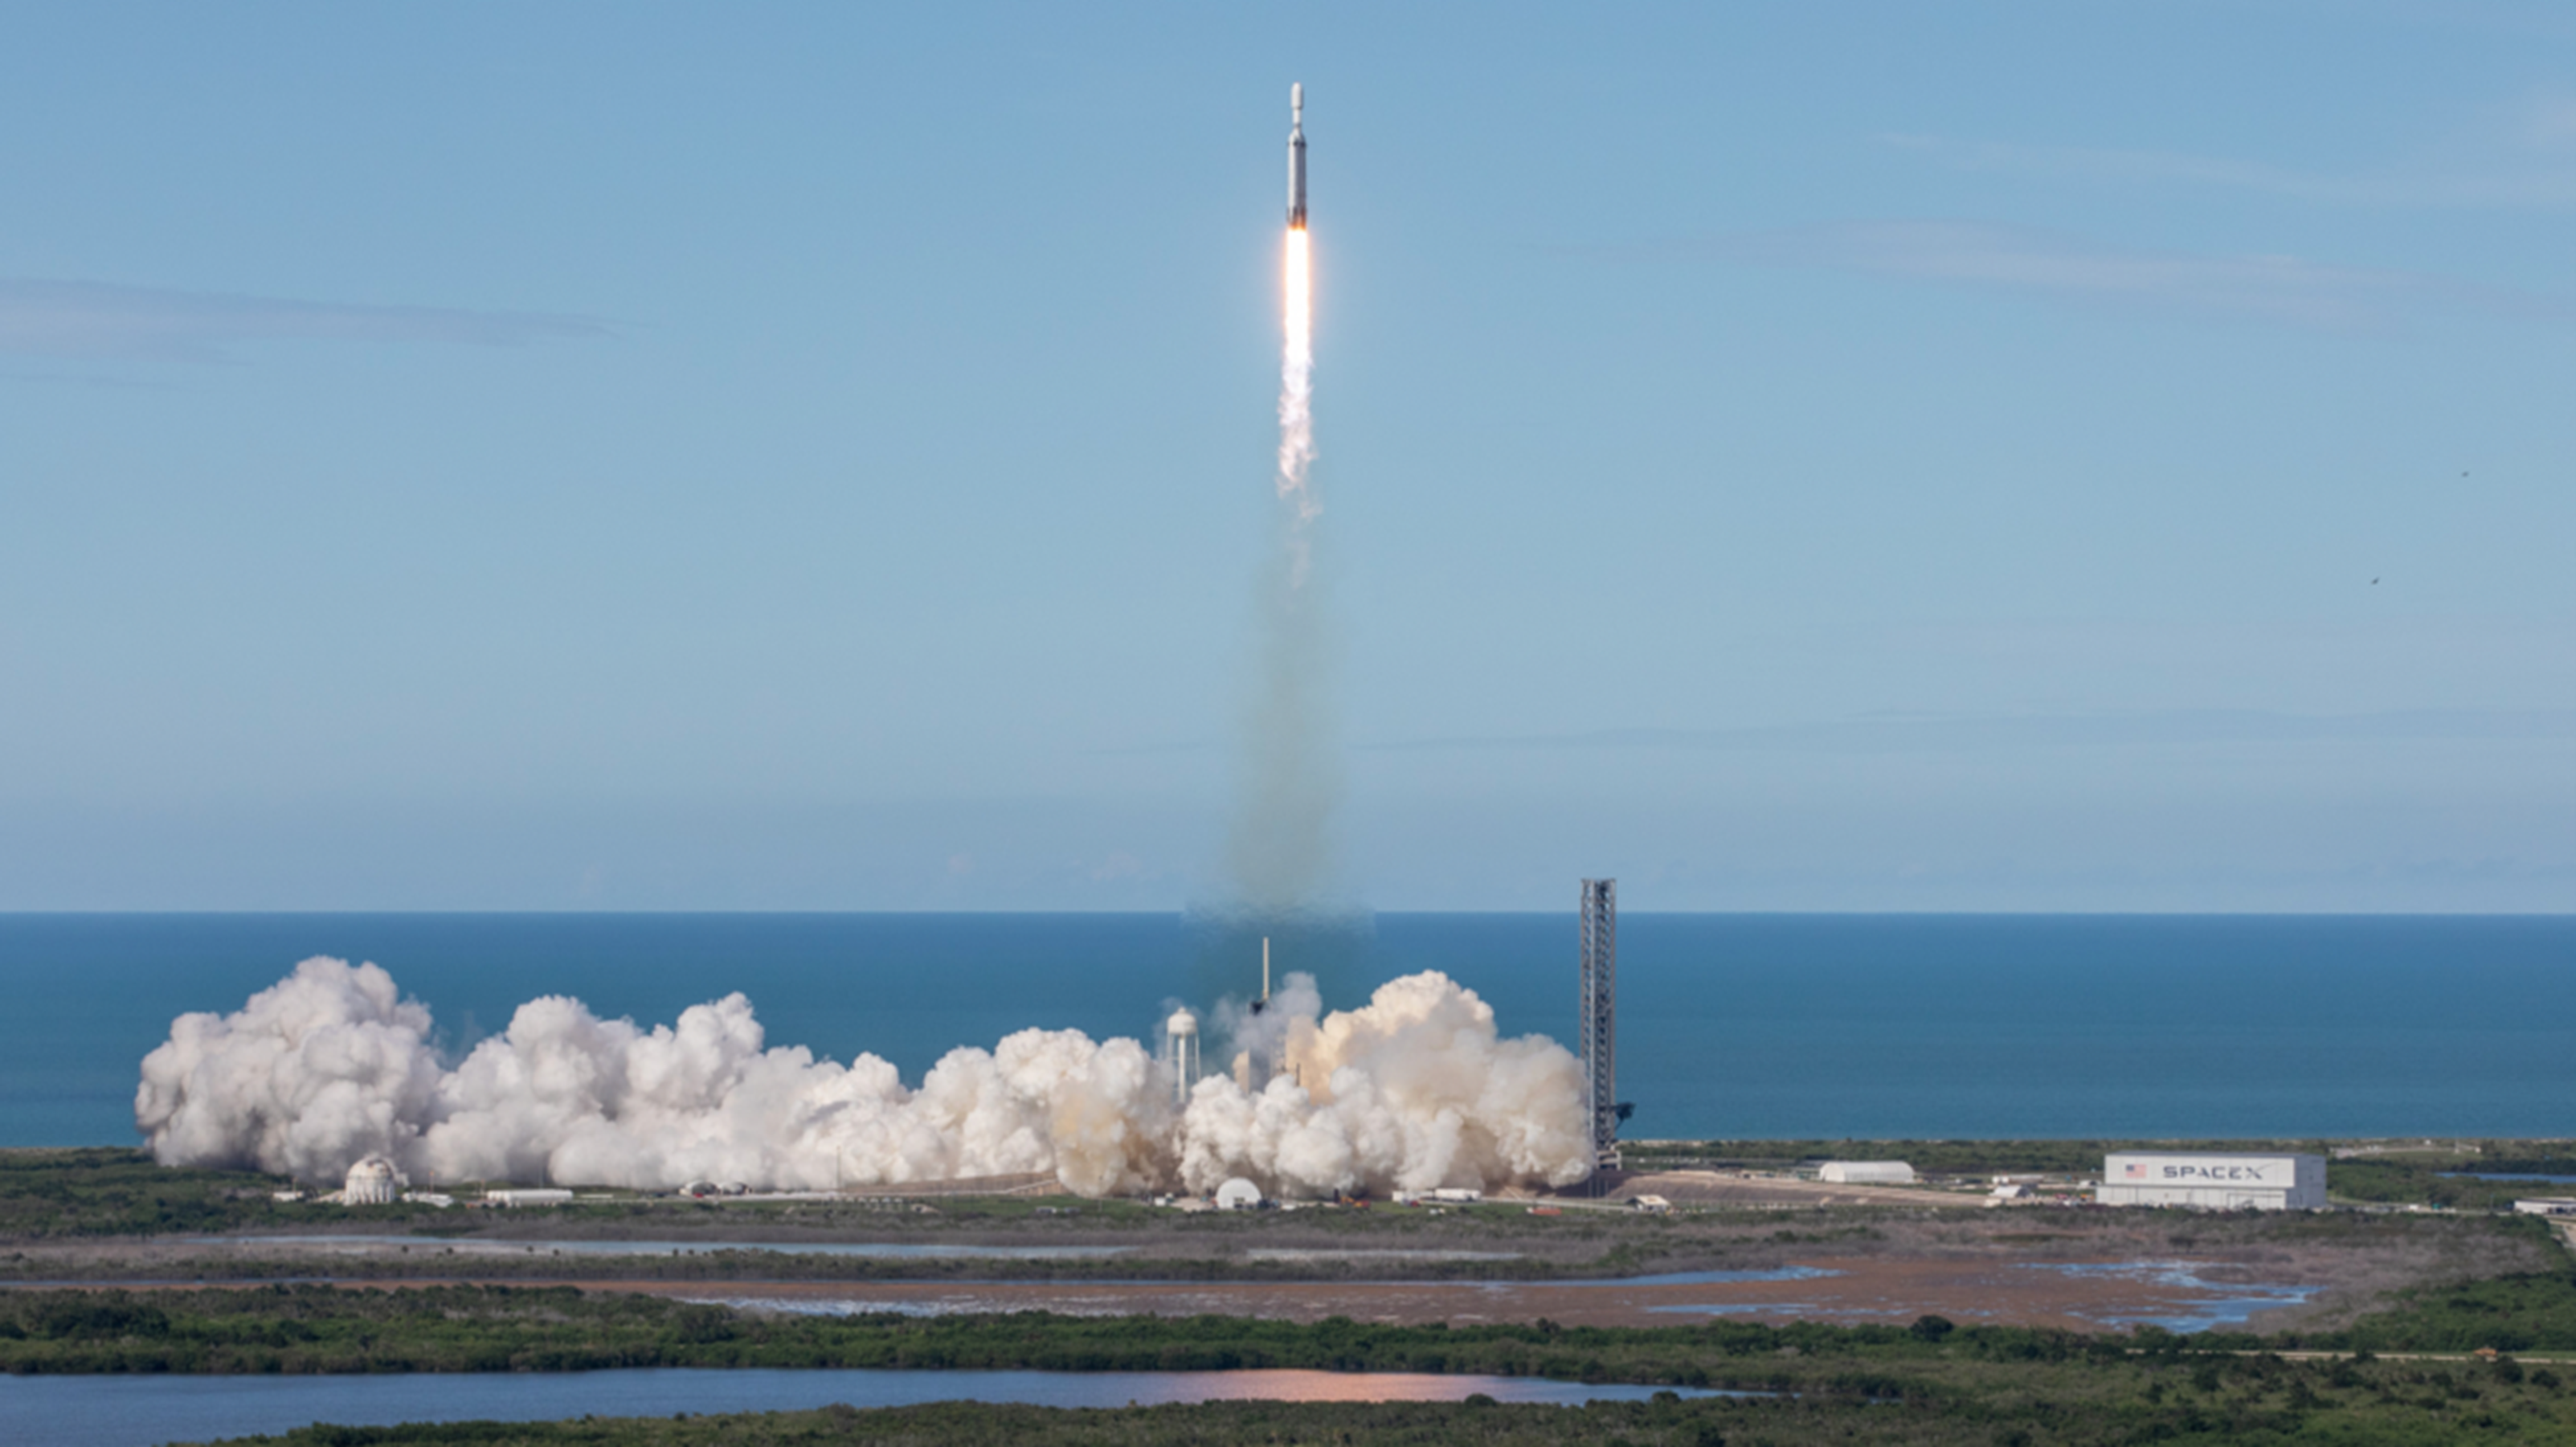
A Milestone in Space and Weather Observation: The Launch of NOAA’s GOES-U Satellite
June 25, 2024, marked a significant milestone in the advancement of weather observation and space technology with the successful launch of GOES-U, the latest of NOAA’s four advanced geostationary satellites. At precisely 5:26 p.m. EDT, a SpaceX Falcon Heavy rocket carried GOES-U into orbit from NASA’s Kennedy Space Center in Florida. This launch is not only a triumph of engineering but also a leap forward in our ability to monitor and predict weather patterns and space weather phenomena.
A Journey to the Stars
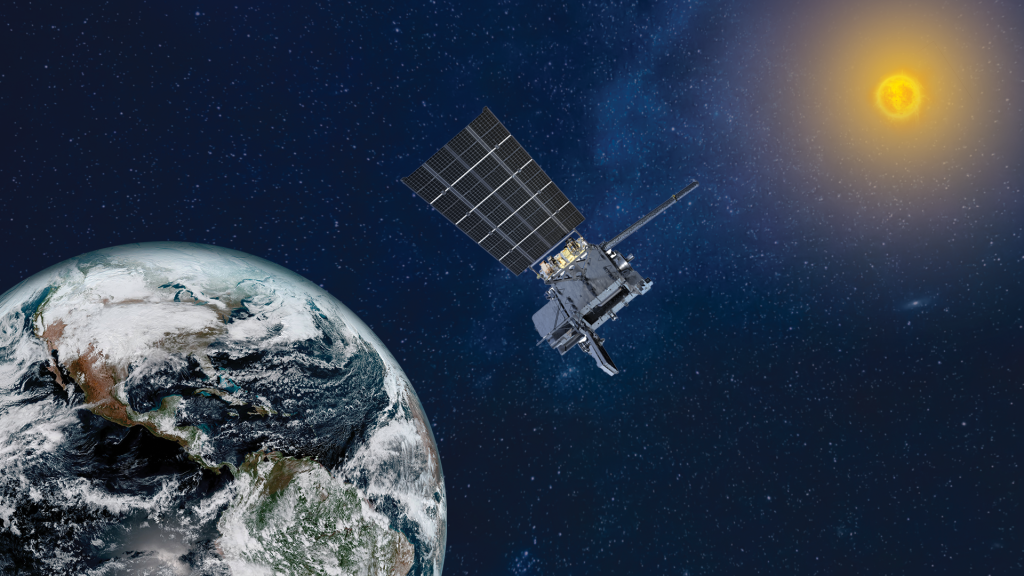
Following its successful deployment, the GOES-U satellite is now operating under its own power and is set to reach its geostationary orbit approximately 22,236 miles above Earth in about 1 week. Once it arrives at this vantage point, GOES-U will be renamed GOES-19. After a comprehensive checkout and validation of its instruments, GOES-19 will take up the GOES-East position in mid-2025, replacing GOES-16. This transition promises to enhance the continuity and quality of weather monitoring services provided by NOAA.
Enhancing Weather Forecasts
“GOES-U will combine high definition with advanced speed and precision to the real-time observations it will capture, which will help improve the accuracy and timeliness of our weather forecasts,” said NOAA Administrator Rick Spinrad, Ph.D. This satellite’s advanced capabilities will ensure that critical data continues to support forecasters into the 2030s, offering more accurate and timely predictions that are crucial for public safety and disaster preparedness.
A Historic First
A groundbreaking feature of GOES-U is its onboard satellite solar coronagraph (CCOR-1), the first operational instrument of its kind. This coronagraph, along with other solar and space environment technology on the satellite, will play a crucial role in detecting hazardous space weather. Such space weather can have significant impacts on power grids, communications, and navigation systems. “GOES is one of the most valuable tools that our meteorologists and hydrologists have in their observational toolbox,” noted NOAA National Weather Service Director Ken Graham. The new coronagraph will expand warning lead times for geomagnetic storms, adding to the life-saving applications provided by GOES-U, such as improved imaging capabilities for hurricanes, fires, and severe storms.
Completing a Legacy
GOES-U is the final satellite in the GOES-R series, a project conceived more than two decades ago. “It completes the GOES-R series of four satellites that were first conceived more than 20 years ago and is expected to operate into the late 2030s,” said Steve Volz, Ph.D., assistant administrator for NOAA’s Satellite and Information Service. Alongside GOES-18, stationed in the GOES-West position, GOES-U will provide comprehensive coverage of more than half the globe, from the west coast of Africa to New Zealand and from Alaska to Antarctica.
The NOAA-NASA Partnership
The GOES-R Series Program exemplifies the successful collaboration between NOAA and NASA. NOAA manages the ground system, operates the satellites, and distributes their data worldwide, while NASA oversees the acquisition of the spacecraft and instruments, also building the Magnetometer instrument for GOES-T and GOES-U. Lockheed Martin is responsible for the design, construction, and testing of the GOES-R series satellites, with L3Harris Technologies providing the primary instrument and ground system.
Looking Ahead: The GeoXO Mission
As we celebrate the launch of GOES-U, NOAA and NASA are already looking to the future with the development of GeoXO (Geostationary Extended Observations), the mission set to follow the GOES-R Series. Scheduled to launch in 2032, GeoXO will not only continue the advanced imagery and lightning detection capabilities of the GOES-R Series but also introduce new observations to monitor the atmosphere, ocean, and climate, addressing growing environmental and health challenges.
The successful launch of GOES-U is a testament to human ingenuity and the spirit of collaboration, marking a new chapter in our quest to understand and protect our planet. As GOES-U begins its mission, the world can look forward to more accurate weather forecasts and a better understanding of the dynamic space environment that surrounds us.
Colorado Drought Update
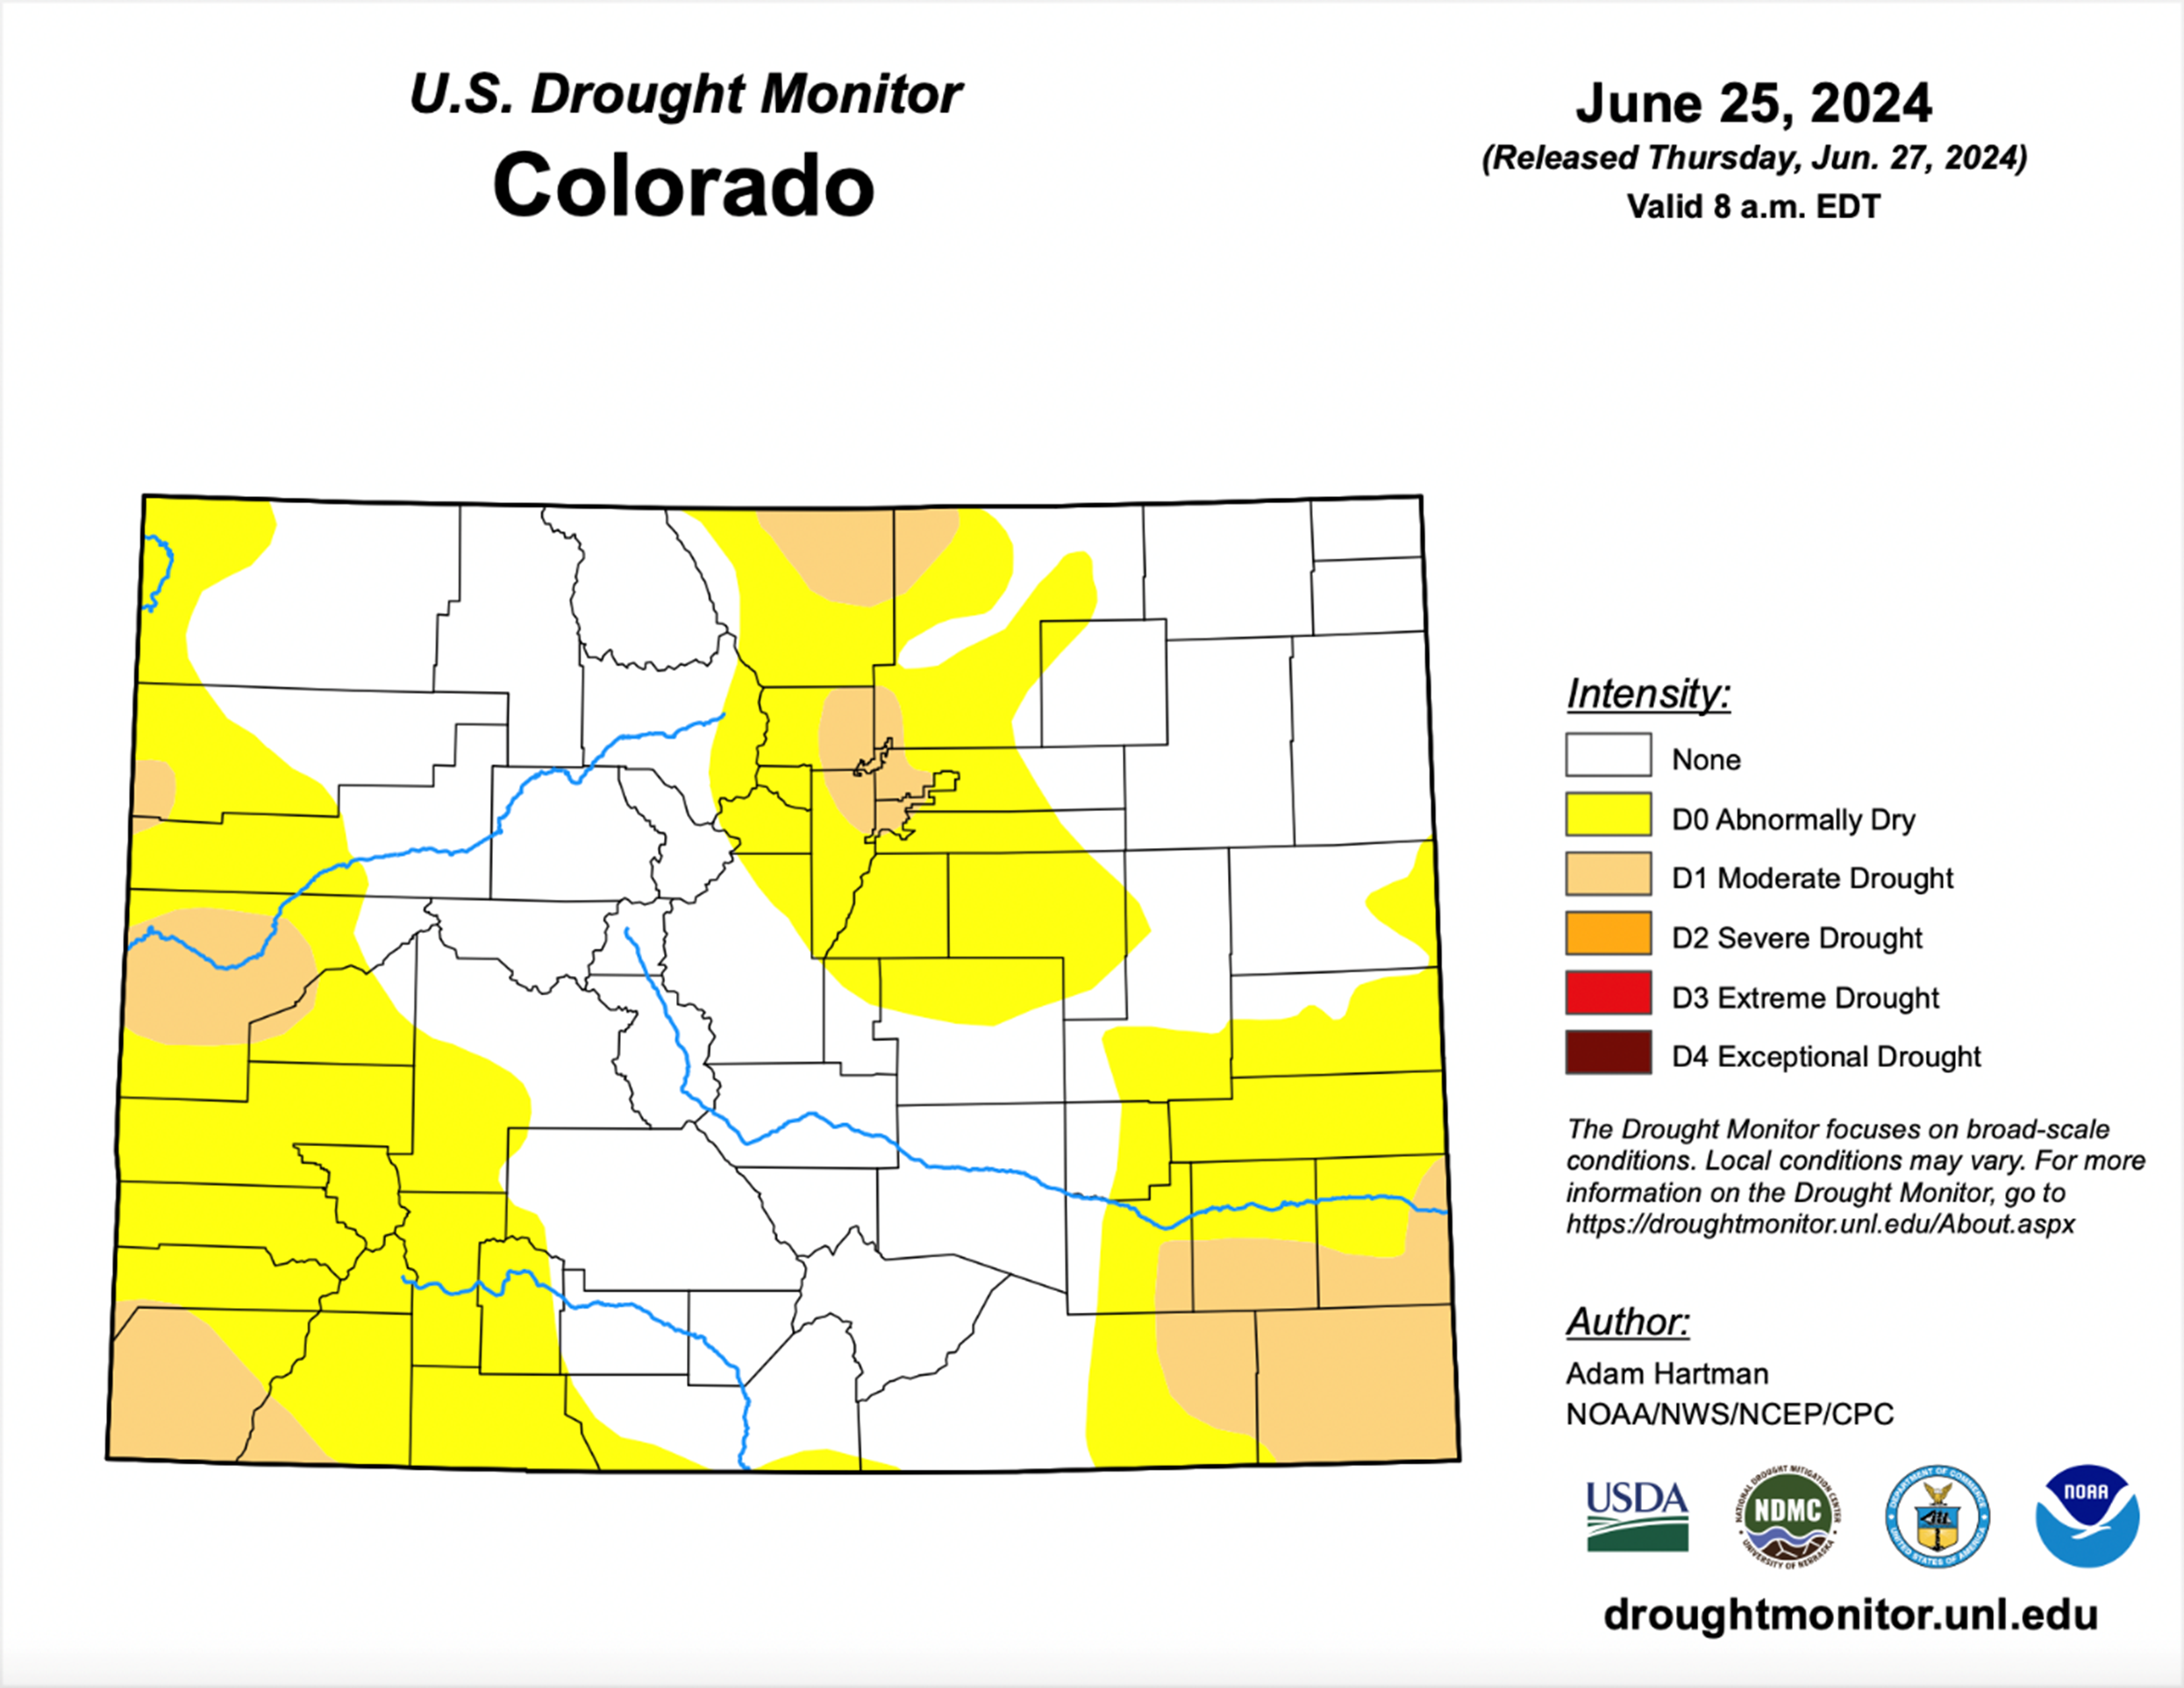
According to the U.S. Drought Monitor report for June 25th, 2024, drought conditions persist across parts of Colorado. The majority of the state remains free from drought conditions; however, specific regions are experiencing changes. Notably, the Denver Metro Area has reached into Moderate Drought territory. With only 6 days of measurable precipitation, Denver is beginning to see the fallout of the drier month of June.
Areas in the southeast part of the state, including Baca and Prowers Counties, have decreased to Moderate Drought status in the far eastern sections. This decrease is primarily attributed to an increase in moisture in those areas from last month. While much of Colorado remains unaffected by drought, localized areas are experiencing increasing severity. Monitoring and managing water resources in these regions are crucial to mitigate the impact of drought.
July 2024 Temperature Anomaly Forecast
The July temperature outlook favors a significant increase from the June temperature pattern. Elevated odds for well above average temperatures are expected across much of the western and central parts of the nation, particularly near the Great Basin region. Other areas such as the Gulf Coast, Florida Peninsula, Intermountain West, and in the Northeast will also experience well above average temperatures during July as well. Conversely, areas in the far Northern Midwest and Great Lakes regions will likely experience seasonal temperatures with no trend in either direction.
July 2024 Precipitation Anomaly Forecast
The U.S. Climate Prediction Center (CPC) anticipates average precipitation patterns for July 2024 across much of the United States, however, localized variations exist. Portions of the North, Cental and Southern Plains as well as the Pacific Northwest regions are expected to receive below-average precipitation, exasterbating dry conditions from last month in areas of the Plains. Conversely, above-average precipitation is forecasted in regions such as the East Coast and Northern Midwest as well as the far Southwest and Alaska.
Weather Summary for Colorado, June 2024
In June 2024, meteorological observations from various regions in Colorado indicated deviations from the typical climatic patterns.
At Denver International Airport (DIA), the mean daily high temperature was recorded as 90.1°F, and the low was 57.5°F. This resulted in an average monthly temperature of 73.8°F, which is 5.6°F above the typical monthly average. The highest temperature recorded was 100°F on June 25th, while the lowest was 50°F on June 3rd and 19th.
Precipitation at DIA was observed to be 0.36 inches, which is 1.58 inches less than the average for June. The most significant precipitation fell on June 9th, where 0.16 inches fell in 24 hours. Overall, four days had measurable precipitation, which is 4.1 days less than the monthly average of 8.1 days.
In southeastern Colorado, including the Colorado Springs area, temperatures were also reported to be above average. The Colorado Springs Airport recorded an average high of 86.7°F and average low of 56.7°F, culminating in a monthly average of 71.5°F, which is 4.3°F above the normal average. The warmest days reached 97°F on June 13th, while the coldest days dropped to 49°F on June 2nd. The airport reported 0.71 inches of precipitation, 1.56 inches below the average, with the majority occurring on June 22nd.
Pueblo, Colorado, experienced higher-than-average temperatures but above-average precipitation. The average daily high was 93.4°F, with a low of 58.7°F. The peak temperature of 104°F was recorded on June 24th. The coldest temperature was 48°F on June 1st. Pueblo received 2.11 inches of precipitation, which is 0.83 inches above the average for June, with most precipitation occurring on June 9th. Overall, southeastern Colorado saw six days with measurable precipitation with one day reporting over an inch.
Pueblo, Colorado, experienced higher-than-average temperatures but above-average precipitation. The average daily high was 93.4°F, with a low of 58.7°F. The peak temperature of 104°F was recorded on June 24th. The coldest temperature was 48°F on June 1st. Pueblo received 2.11 inches of precipitation, which is 0.83 inches above the average for June, with most precipitation occurring on June 9th. Overall, southeastern Colorado saw six days with measurable precipitation with one day reporting over an inch.
In addition to the temperature and precipitation anomalies, June 2024 was also marked by several severe weather events across Colorado. On June 8th, a severe storm swept across Colorado, bringing heavy rain, hail up to the size of baseballs, and damaging winds. The most severe weather affected Colorado’s plains eastward of Greeley. The largest hail reported, measuring 2 3/4 inches in diameter, was recorded in Seibert, a town in Kit Carson County. The strongest wind gust was recorded at 72 mph in Deer Trail, in eastern Arapahoe County. In the Denver area, winds reached up to 60 mph. A tornado of unknown magnitude touched down in Flagler, a town in eastern Colorado’s Kit Carson County, around 4:30 p.m. on June 8th. Several social media users reported seeing supercell storm clouds — rotating thunderstorms that can spawn tornadoes — between Washington County’s town of Cope and Kit Carson County.
In conclusion, June 2024 was characterized by above-average temperatures and below-average precipitation in most parts of Colorado. However, several severe weather events, including heavy rain, large hail, strong winds, and tornadoes, were also reported across the state.
Weather Statistics for Denver International Airport (DIA), June 2024
DIA Temperature (°F), June 2024
| Observed Value | Normal Value | Departure From Normal | |
| Average Max | 90.1°F | 83.4°F | 6.7°F |
| Average Min | 57.5°F | 53.0°F | 4.5°F |
| Monthly Mean | 73.8°F | 68.2°F | 5.6°F |
| Days With Max 90 Or Above | 16 | 8.6 | 7.4 |
| Days With Max 32 Or Below | 0 | 0 | 0 |
| Days With Min 32 Or Below | 0 | 0 | 0 |
| Days With Min 0 Or Below | 0 | 0 | 0 |
| Highest | 100°F on 6/25 | ||
| Lowest | 50°F on 6/03 & 6/19 |
DIA Liquid Precipitation (Inches), June 2024
| Observed Value | Date(s) | Normal Value | Departure From Normal | |
| Monthly Total | 0.36” | 1.94” | -1.58” | |
| Yearly Total | 8.73” | 7.43” | 1.3” | |
| Greatest In 24 Hours | 0.16” | 06/09 | ||
| Days With Measurable Precip. | 4 | 8.1 | -4.1 |
2024 Rainfall Accumulation for the Colorado Eastern Plains
| City | May | June | July | Aug | Sept | Total |
| Aurora (Central) | 1.17 | 0.29 | 1.46 | |||
| Boulder | 0.26 | 0.35 | 0.61 | |||
| Brighton | 0.57 | 0.41 | 0.98 | |||
| Broomfield | 0.77 | 0.35 | 1.12 | |||
| Castle Rock | 1.59 | 1.65 | 3.24 | |||
| Colo Sprgs Airport | 0.82 | 0.51 | 1.33 | |||
| Denver DIA | 1.70 | 0.36 | 2.06 | |||
| Denver Downtown | 1.21 | 0.07 | 1.28 | |||
| Golden | 0.98 | 0.58 | 1.56 | |||
| Fort Collins | 0.93 | 0.51 | 1.44 | |||
| Highlands Ranch | 1.81 | 0.52 | 2.33 | |||
| Lakewood | 1.03 | 0.74 | 1.77 | |||
| Littleton | 1.39 | 0.38 | 1.77 | |||
| Monument | 1.79 | 0.50 | 2.29 | |||
| Parker | 1.63 | 1.01 | 2.64 | |||
| Sedalia – Hwy 67 | 1.94 | 1.03 | 2.97 | |||
| Thornton | 0.37 | 0.28 | 0.65 | |||
| Westminster | 0.65 | 0.47 | 1.12 | |||
| Wheat Ridge | 0.75 | 0.42 | 1.17 | |||
| Windsor | 0.94 | 1.36 | 2.30 |
July 2024 Preview
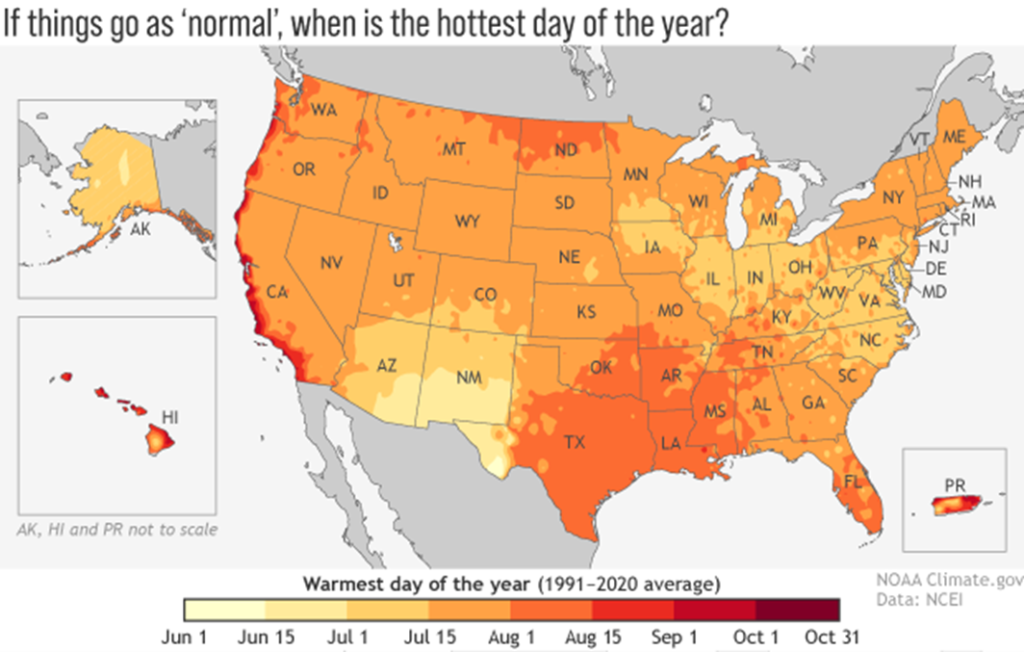
Across the United States, the hottest temperatures of the year arrive, on average, around a month after the June 21st summer solstice. This varies by region: parts of the southwest typically experience their hottest temperatures in June before the onset of the summer monsoon, and the coastal regions along the Pacific do not see their highest temperatures until the California Current warms and Santa Ana winds hit their peak in early fall. Colorado, however, falls in line with the rest of the country, and usually experiences its hottest days of the year between July 17th-22nd.
2024 appears as though it will show only a slight deviation from this July 17th-22nd normal. An intense heat wave is currently impacting California and is set to migrate slowly eastward. And while this heat wave won’t push temperatures in Colorado near 130°F like it will in Death Valley, California, widespread near-triple digit temperatures for multiple days are likely by the end of July’s second week. Should this be the most intense heatwave of the season (August will remain to be seen), Colorado will likely hit its peak average daily temperature sometime between July 11th-16th.
The relieving thing about July heatwaves in Colorado is that they are usually followed by a few days of widespread rainfall as result of the North American Monsoon. Flow out of the south along the heatwave’s western edge drags tropical moisture up into Colorado, providing widespread rainfall and much needed heat relief. The good news is this appears to be the case for this mid-month heatwave. The bad news is, despite the arrival of monsoonal moisture later in the month, the overall outlook for July appears similar to June: hot and relatively dry. The dog days of summer are coming!
July Climatology for Denver
(Normal Period 1991-2020 Dia Data)
Temperature
| Temperature | Observed Value |
| Average High | 89.4°F |
| Average Low | 58.9°F |
| Monthly Mean | 74.2°F |
| Days With High 90 Or Above | 16 |
| Days With High 32 Or Below | 0 |
| Days With Low 32 Or Below | 0 |
| Days With Lows Zero Or Below | 0 |
Precipitation
| Precipitation | Observed Value |
| Monthly Mean | 2.10” |
| Days With Measurable Precipitation | 8 |
| Average Snowfall In Inches | 0.0” |
| Days With 1.0 Inch Of Snow Or More | 0 |
Miscellaneous Averages
| Heating Degree Days | 6 |
| Cooling Degree Days | 289 |
| Wind Speed (Mph) | 8.3 mph |
| Wind Direction | South |
| Days With Thunderstorms | 11 |
| Days With Dense Fog | 0 |
| Percent Of Sunshine Possible | 71% |
Extremes
| Record High | 105 on 7/20/2005 |
| Record Low | 42 on 7/4/1903, 7/31/1873 |
| Warmest | 78.9 in 2012 |
| Coldest | 67.3 in 1895 |
| Wettest | 6.41” in 1965 |
| Driest | 0.01” in 1901 |
| Snowiest | 0.0” |
| Least Snowy | 0.0” |
The Skyview Weather Newsletter is a monthly publication that aims to provide readers with engaging and informative content about meteorological science. Each issue features articles thoughtfully composed by Skyview’s team of meteorologists, covering a wide range of topics from the birth of Doppler Radar to the impact of weather phenomena. The newsletter serves as a platform to share the latest advancements in weather forecasting technology and the science behind it, enhancing our understanding of weather.
Skyview Weather has been a pillar for reliable weather services for over 30 years, providing unparalleled forecasts and operations across the Continental US. We offer a comprehensive suite of services that range from live weather support to detailed forecasts, extensive weather data collection, and weather reporting. Our clients, ranging from concert venues to golf courses, theme parks to hotels, schools to police departments, and more, rely on Skyview Weather for winter and summer weather alerts, now available on the Skyview Weather mobile app. These alerts cover a broad spectrum of weather conditions, including snow, lightning, hail, tornadoes, severe weather, and heavy rain. Learn more about how Skyview Weather products and services can support your organization through severe, winter, flood, and fire weather.