June 2024 Skyview Weather Monthly Newsletter
Feature Article
The Birth of Doppler Radar
The development of Doppler radar technology has significantly impacted meteorological science, enhancing our ability to predict and understand severe weather phenomena. The genesis of Doppler radar can be traced back to the Doppler effect, first described by Austrian physicist Christian Doppler in 1842. This principle, which explains the change in frequency or wavelength of a wave in relation to an observer moving relative to the wave source, forms the foundation of Doppler radar technology. This effect is commonly observed in the change of pitch of a siren as it moves toward and then away from an observer.
Early Advances in Doppler Radar
The application of the Doppler effect in radar technology began to gain traction in the 1950s. Initial efforts were scattered across various nations, but it was during this period that researchers began to see the potential for Doppler radar to detect and track weather phenomena, particularly tornadoes. The National Severe Storms Laboratory (NSSL) played a pivotal role in advancing this technology. Their research and experiments laid the groundwork for the practical use of Doppler radar in meteorology.
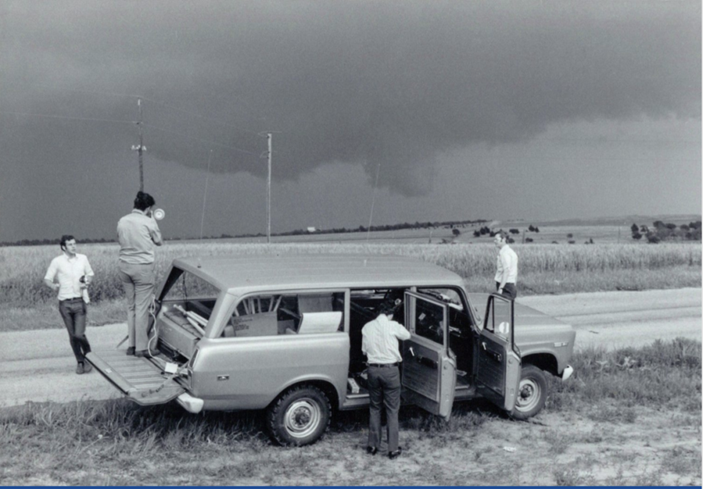
Union City Tornado: A Watershed Moment
A significant milestone in Doppler radar history was the Union City tornado on May 24, 1973. This F-4 tornado struck central Oklahoma, causing widespread devastation. However, it also provided a unique opportunity for scientists. For the first time, researchers at NSSL were able to observe the entire lifecycle of a tornado using the recently commissioned experimental Norman Doppler Radar. The data collected during this event were groundbreaking, offering a comprehensive view of tornado behavior and dynamics, far beyond the isolated snapshots previously available.
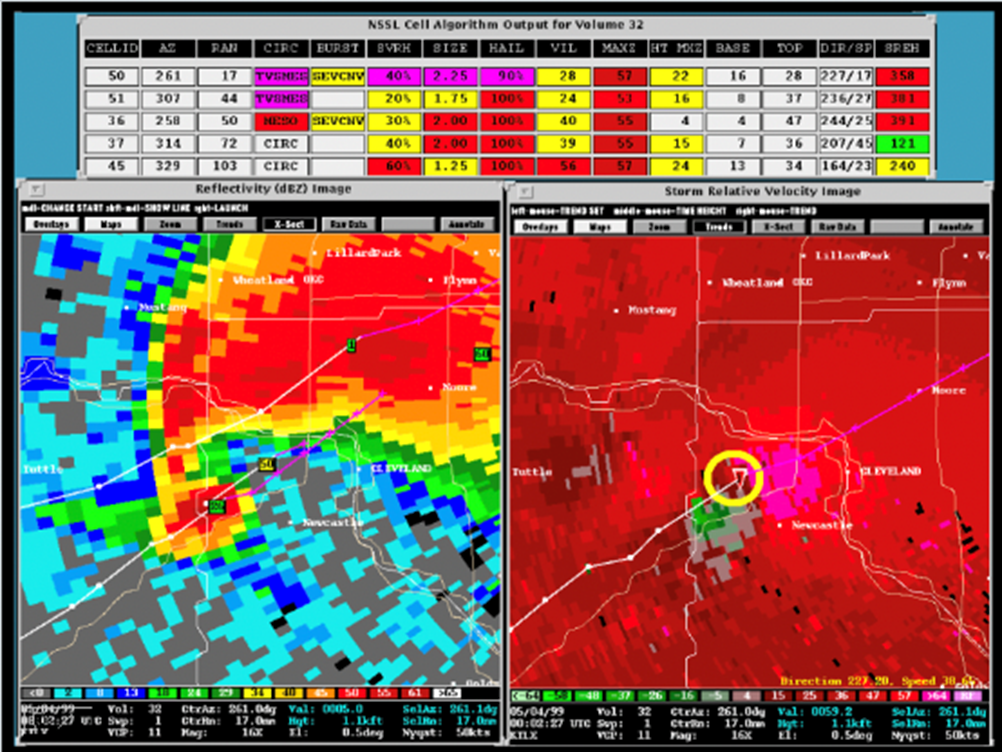
Unveiling the Tornadic Vortex Signature (TVS)
The analysis of Doppler radar data from the Union City tornado led to the identification of a crucial rotational signature within the storm, known as the tornadic vortex signature (TVS). This discovery was pivotal, as the TVS provided an early indication of tornado formation, significantly improving warning lead times. Forecasters could now issue more timely and accurate warnings, providing the public with precious minutes to take life-saving actions.
Evolution of Doppler Radar Technology
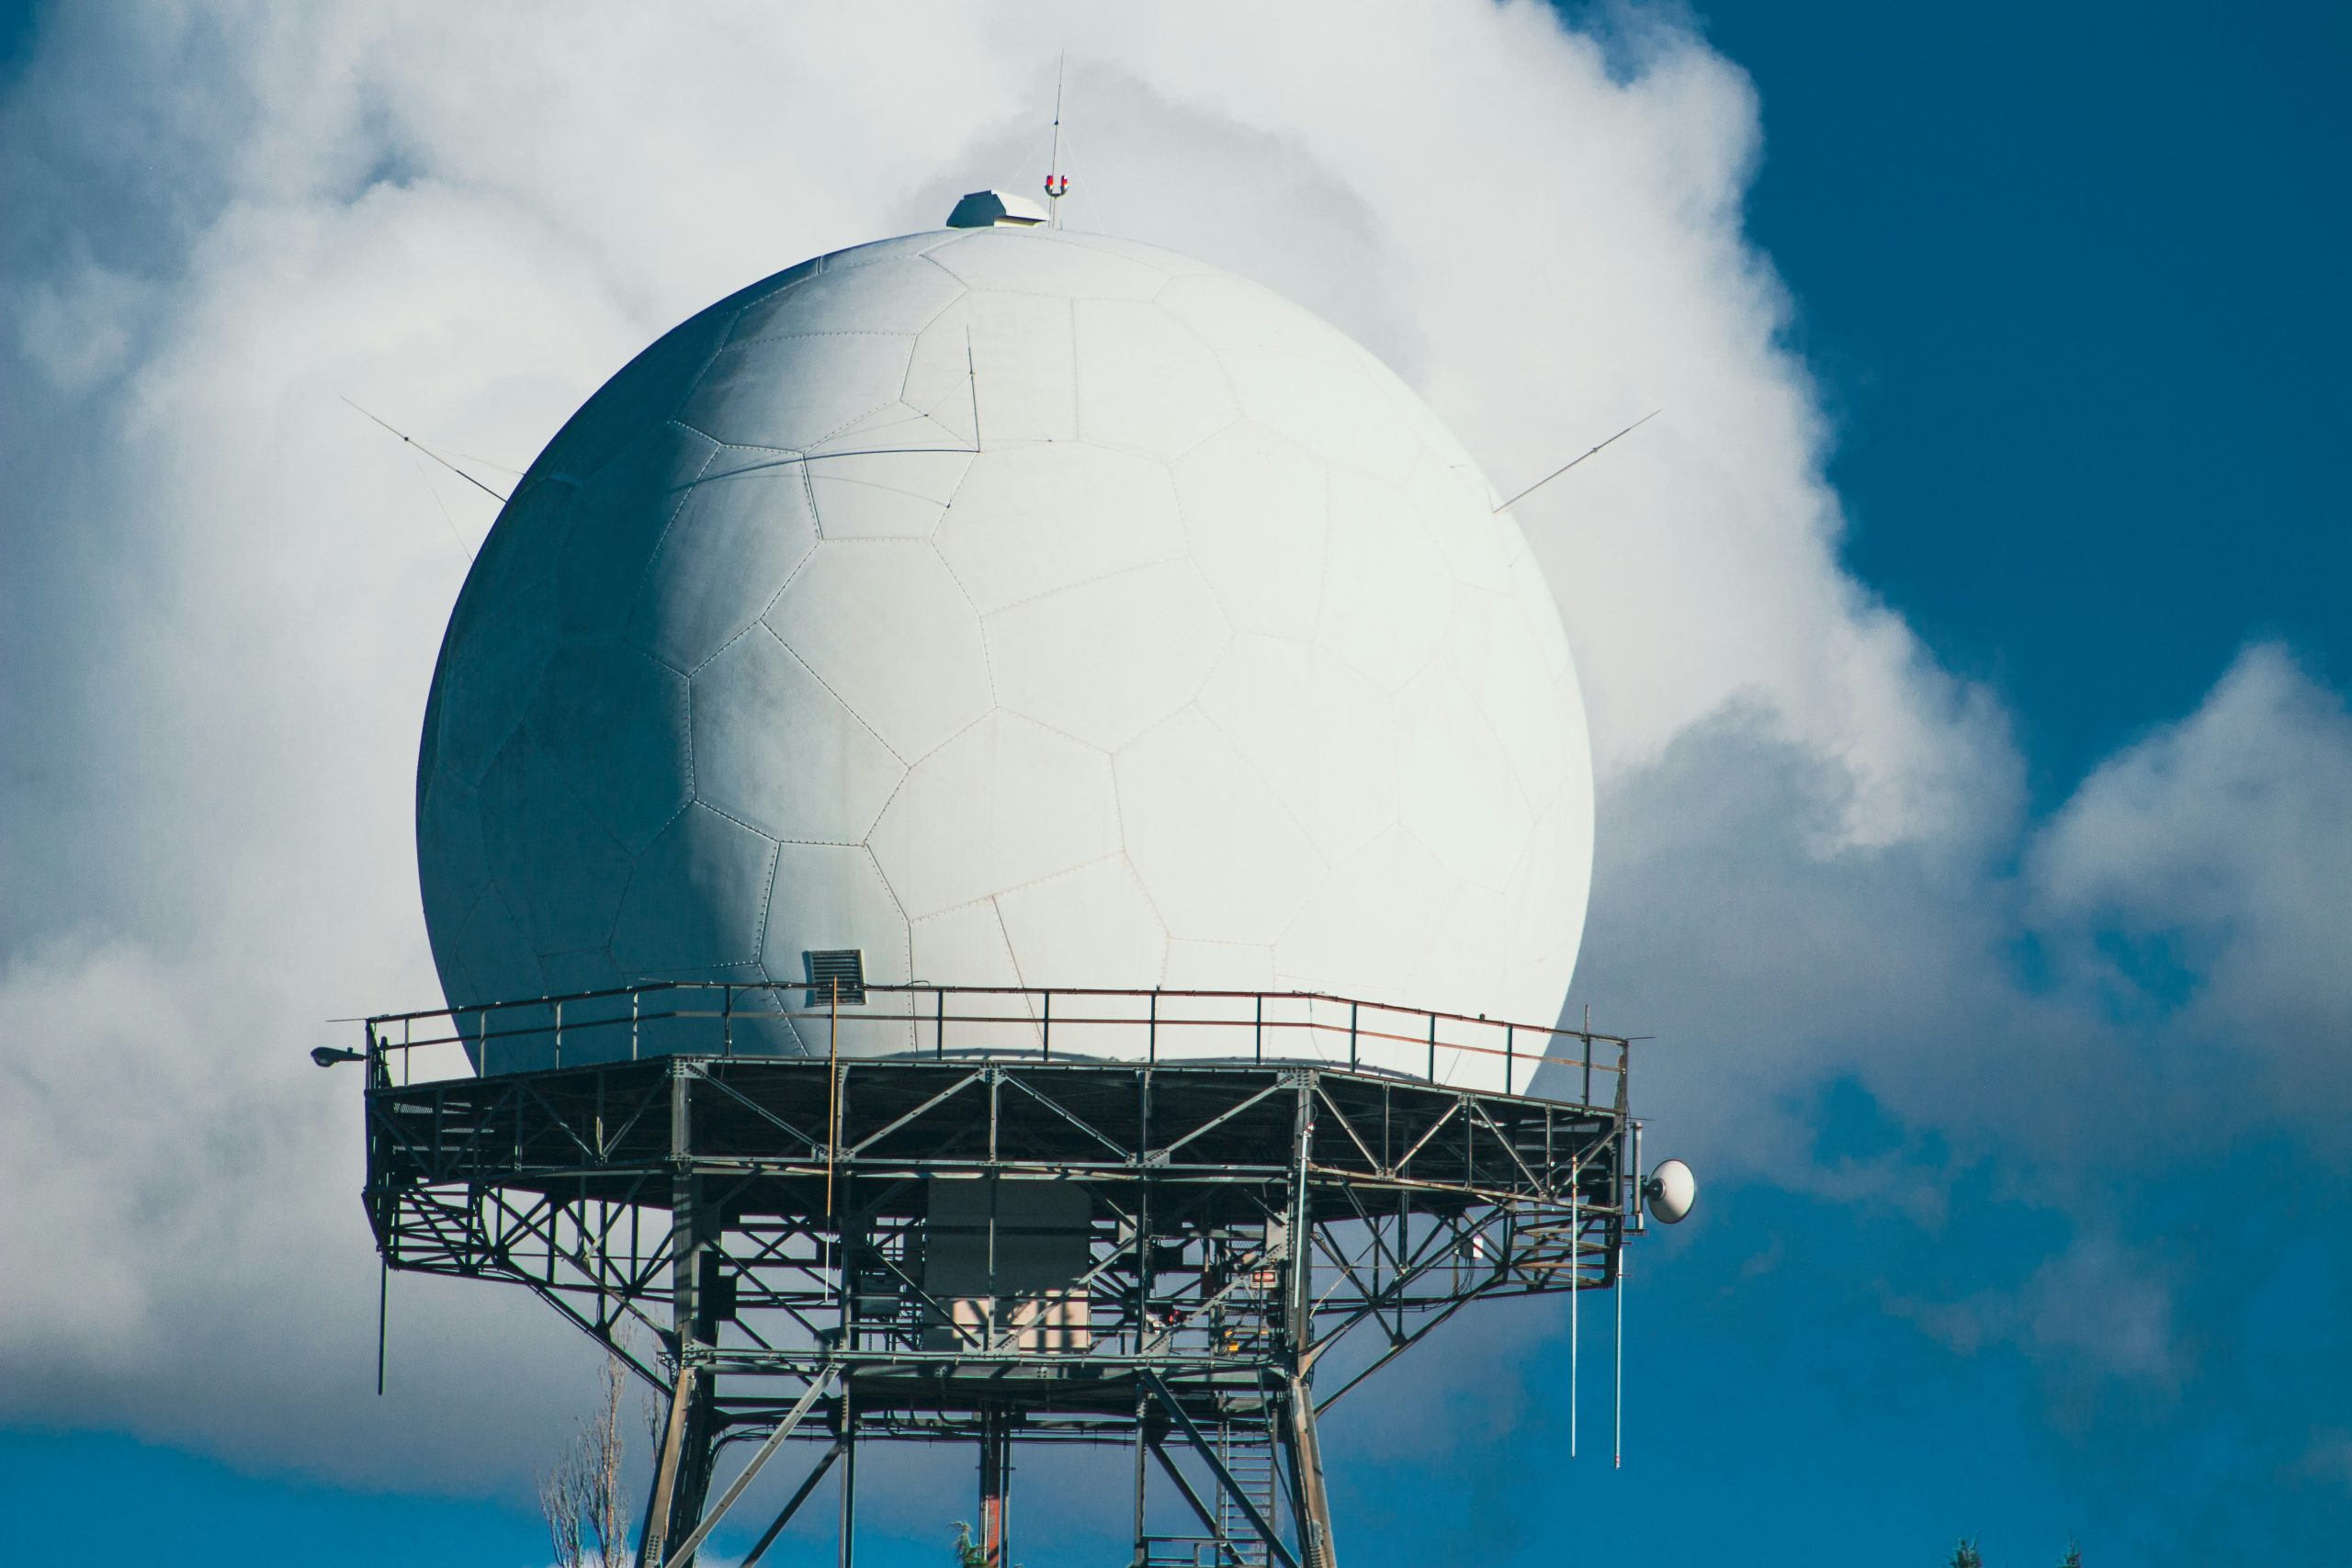
Doppler radar technology has continued to evolve, particularly through the development of the Next Generation Radar (NEXRAD) system. NEXRAD, also known as the WSR-88D, was introduced in the late 1980s and has become a cornerstone of modern weather forecasting. NEXRAD radars utilize advanced Doppler technology to measure the velocity of precipitation particles, enabling meteorologists to detect rotation within storms and issue warnings with greater precision.
Further advancements have included dual-polarization radar, which provides additional information about the size, shape, and composition of precipitation particles. This technology enhances the accuracy of precipitation estimates and helps in identifying severe weather features such as hail and tornado debris signatures. The integration of dual-polarization with Doppler radar has been one of the most significant upgrades, allowing for improved detection and analysis of severe weather events.
Implications of Doppler Radar
The implications of Doppler radar for weather forecasting and public safety are profound. The ability to detect storm rotation and provide early warnings has dramatically increased the lead time for tornado warnings, which can be critical for saving lives and reducing property damage. The data from Doppler radar have also contributed to a deeper understanding of storm dynamics and behavior, aiding in the development of more accurate weather models and forecasts.
The initial data from the Union City tornado were recorded on magnetic tape and required significant computer processing for thorough analysis. However, these early efforts demonstrated the critical role of radar technology in weather prediction. Today, Doppler radar remains an indispensable tool for meteorologists, continuously providing vital information that helps protect lives and property during severe weather events.
Ongoing Research and Future Directions
The NSSL and other research institutions continue to explore new radar technologies, such as phased array radar, which promises even faster and more detailed storm observations. This research aims to further extend tornado warning lead times and improve the accuracy of severe weather forecasts.
In conclusion, the Union City tornado and the pioneering efforts of NSSL with Doppler radar marked a significant advancement in meteorological science. The continued development and enhancement of radar technology underscore its critical role in our ongoing efforts to understand and mitigate the impacts of severe weather.
Colorado Drought Update
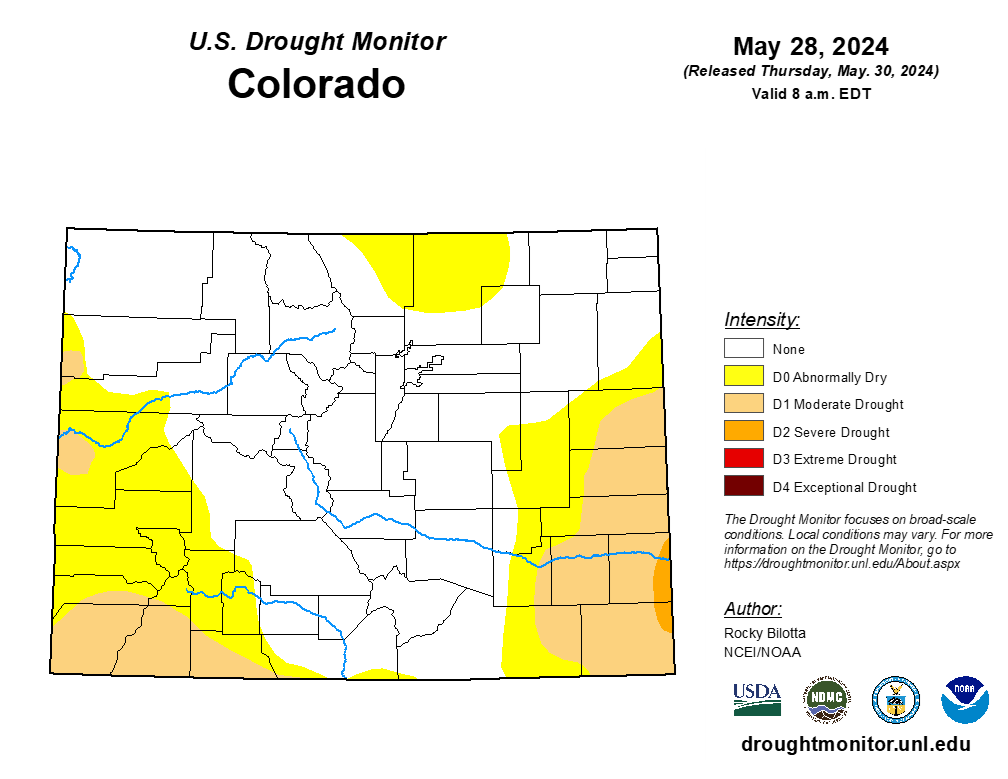
According to the U.S. Drought Monitor report for May 21, 2024, drought conditions persist across parts of Colorado. The majority of the state remains free from drought conditions; however, specific regions are experiencing changes. Notably, northern Weld and Larimer counties, as well as La Plata and Archuleta Counties, are gradually moving into drought territory.
Unfortunately, areas in the southeast part of the state, including Baca and Prowers Counties, have escalated to Severe Drought status in the far eastern sections. This severity is primarily attributed to insufficient moisture in the affected areas.
Late-season snow drought conditions have developed in southwest Colorado, despite near-to-above-normal peak snow water equivalent (SWE) levels in certain basins. The Intermountain West region, including Colorado, currently reports 9% in drought, with no extreme or exceptional drought conditions (D3–D4) present. In summary, while much of Colorado remains unaffected by drought, localized areas are experiencing increasing severity. Monitoring and managing water resources in these regions are crucial to mitigate the impact of drought.
June 2024 Temperature Anomaly Forecast
The June temperature outlook favors a change from the May temperature pattern. Elevated odds for well above average temperatures are expected across much of the western and central parts of the nation, including areas along the Gulf Coast to Florida, around the Great Lakes, Intermountain West, Great Basin, Pacific Northwest, and in the Northeast. However, there is no significant tilt in odds toward a specific temperature category over the remainder of the country.
June 2024 Precipitation Anomaly Forecast
The U.S. Climate Prediction Center (CPC) anticipates precipitation patterns for June 2024 across the United States. While most regions will experience near-average precipitation, localized variations exist. Portions of the Northern Plains and the Yellowstone region are expected to receive below-average precipitation, potentially leading to drier conditions compared to historical norms. Conversely, above-average precipitation is forecasted in specific regions. The Pacific Northwest is likely to experience increased rainfall relative to historical averages. The Southern Great Plains, including states such as Texas and Oklahoma, can expect above-normal rainfall. Additionally, the Ozarks region, spanning parts of Missouri, Arkansas, and surrounding states, is also likely to receive higher-than-normal precipitation. Lastly, New England states, including Maine, Vermont, New Hampshire, Massachusetts, Rhode Island, and Connecticut, should prepare for elevated precipitation levels. Monitoring these precipitation patterns is crucial for water resource management, agriculture, and ecological health.
Colorado May Weather Summary
In May 2024, Denver International Airport (DIA) experienced temperatures slightly above the average, with a mean daily high of 63.9°F and a low of 37.1°F, resulting in an average monthly temperature of 50.5°F. This was 2.7°F higher than the typical monthly average of 47.8°F1. The highest temperature recorded was 80°F on April 14th, while the lowest was 24°F on April 5th.
DIA observed 3.28 inches of precipitation, which is 1.60 inches more than the average for April. Throughout the month, five storm systems were observed, contributing to a total snow accumulation of 6.3 inches at DIA. The most significant snowfall occurred between April 19th and 21st, affecting the northern Metro areas and resulting in a balanced snow distribution across the Denver Metro area into Douglas County.
In the Denver Metro area, snowfall ranged from 3.0 to 6.0 inches, with isolated higher amounts. The foothills and regions above 6,500 feet received 10.0 to 20.0 inches of snow due to elevation and temperature factors.
Southeastern Colorado, including the Colorado Springs area, also reported above-average temperatures. Colorado Springs Airport recorded an average high of 63.8°F and a low of 36.6°F, culminating in a monthly average of 50.2°F, which is 2.7°F above the normal average of 47.5°F2. The warmest days reached 78°F on April 14th, 22nd, and 30th, while the coldest days dropped to 28°F on April 9th and 11th. The airport reported 1.52 inches of precipitation, slightly above the average, with the majority occurring on April 27th.
Pueblo, Colorado, experienced higher-than-average temperatures with below-average precipitation. The average daily high was 70.2°F, with a low of 37.5°F. The peak temperature of 90°F was recorded on April 30th, marking the first occurrence of such warmth for the year. The coldest temperature was 25°F on April 8th. Pueblo received only 1.07 inches of precipitation, which is 0.50 inches below the average for April, with most precipitation occurring on April 27th.
Overall, southeastern Colorado saw limited weather events, with only four notable occurrences in April. Warmer conditions led to minimal roadway impacts as most snow melted upon contact with the pavement. Snowfall totals for the Palmer Divide ranged from 5.0 to 9.0 inches, with northern Colorado Springs receiving 0.5 to 2.0 inches, and central to southern Colorado Springs seeing a trace to 0.5 inches. Pueblo and Cañon City reported negligible snowfall for the month.
Weather Statistics for Denver International Airport, May 2024
DIA May 2024 Temperature (°F)
| Observed Value | Normal Value | Departure From Normal | |
| Average Max | 70.6°F | 95°F | -12°F |
| Average Min | 43.2°F | 19°F | 11°F |
| Monthly Mean | 56.9°F | 71.2°F | -0.6°F |
| Days With Max 90 Or Above | 0 | 0.8 | -0.4 |
| Days With Max 32 Or Below | 0 | 0 | -0.5 |
| Days With Min 32 Or Below | 2 | 2.9 | -0.8 |
| Days With Min 0 Or Below | 0 | 0 | 0 |
DIA May 2024 Liquid Precipitation (Inches)
| Observed Value | Date(S) | Normal Value | Departure From Normal | |
| Monthly Total | 1.70” | 2.16” | 5.53” | |
| Yearly Total | 8.37” | 5.72” | 2.65” | |
| Greatest In 24 Hours | 0.72” | 5/20-5/21 | ||
| Days With Measurable Precip. | 5 | 10.4 | -5.4 |
June 2024 Preview
A preview of Colorado’s most active severe weather month arrived just 30 hours before the calendar flipped from May to June. A poorly forecasted pocket of cold air aloft sat atop moist air over the surface of the Denver metro, waiting for the right trigger to explode. And explode it did. The resultant hailstorm tracked from Broomfield, through Commerce City, and to just south of DIA, causing remarkable damage across an almost 30-mile swath.
Colorado in June is a prime location for severe weather. According to the National Weather Service, Colorado, on average, records 13 tornadoes in the month of June (only just beating out the average of 12 in May). This June is shaping up to be no different from years past in regard to thunderstorm activity in Colorado.
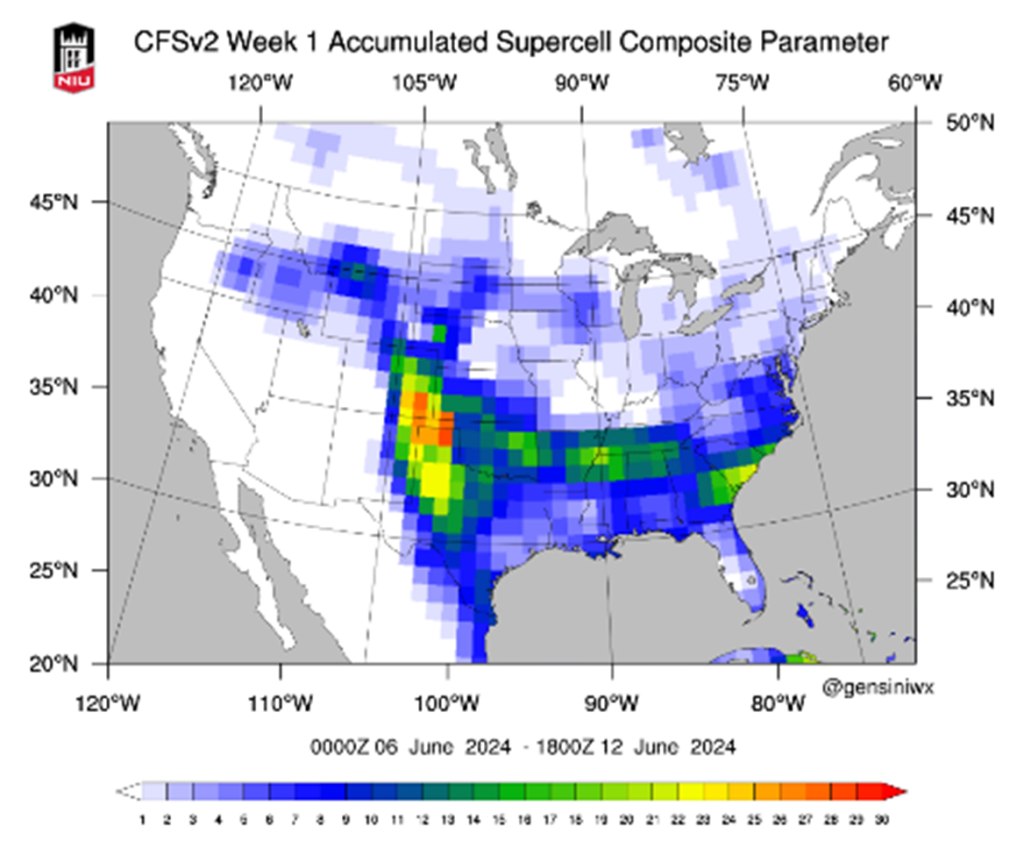
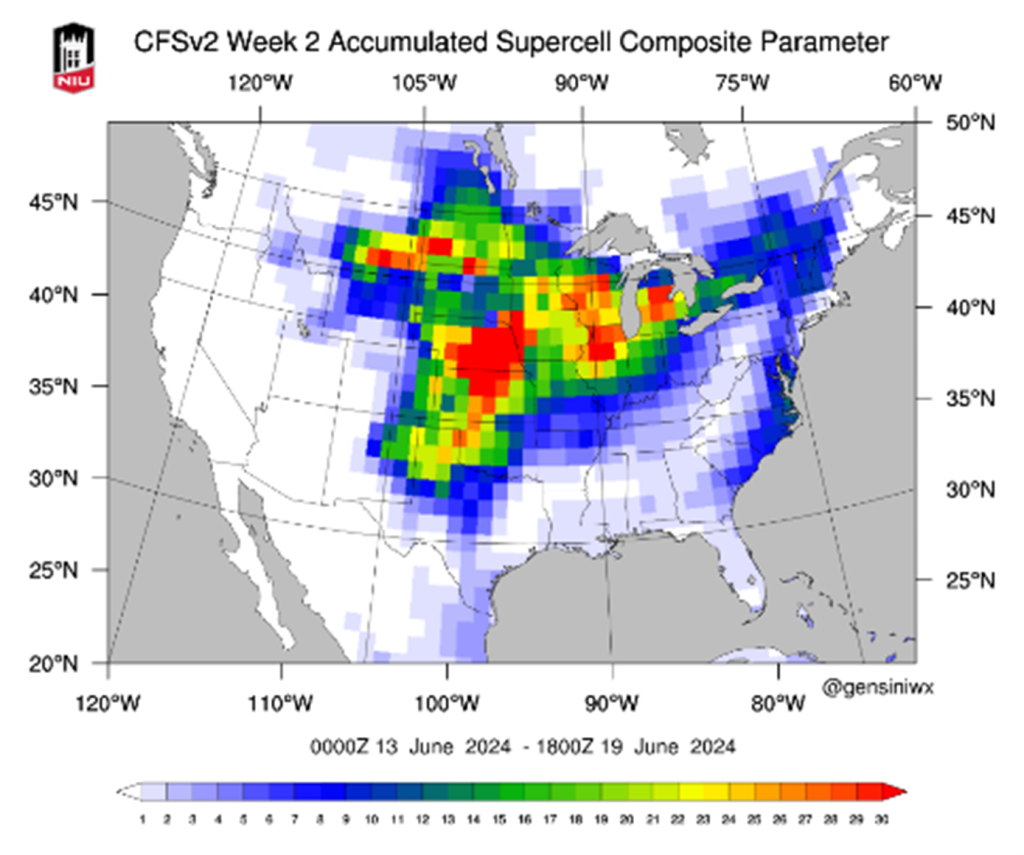
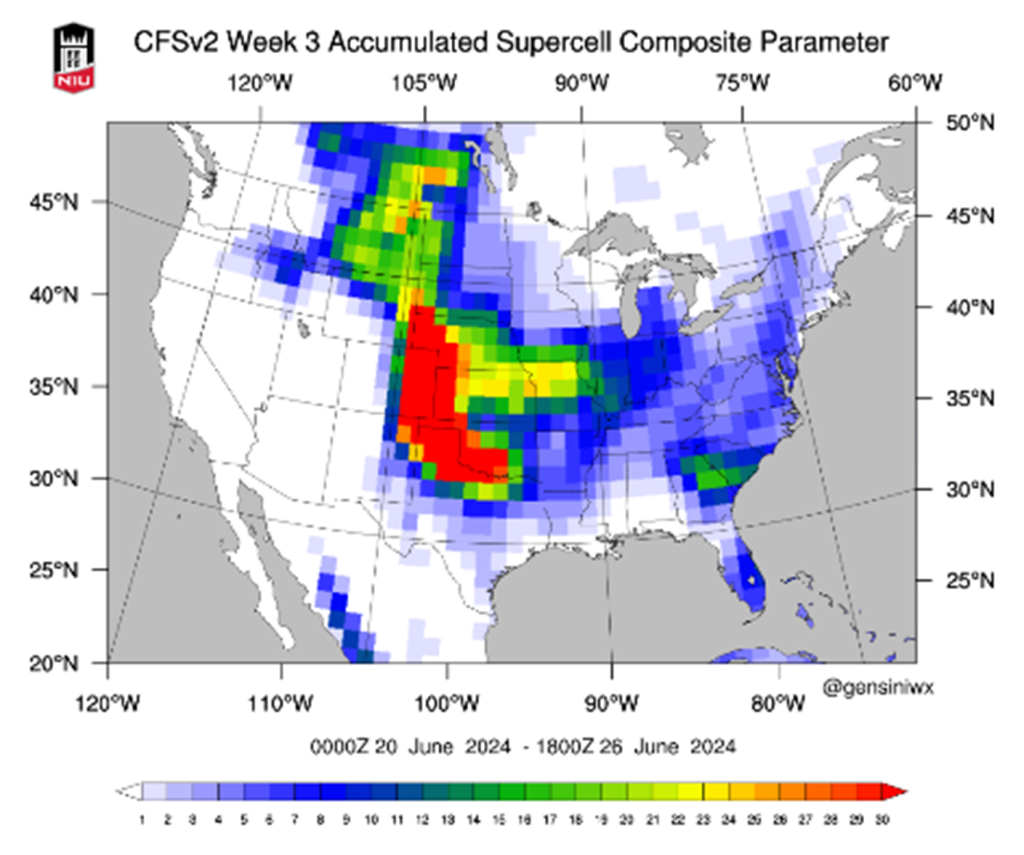
We take climate models with a grain of salt here at Skyview Weather, but, based on the maps above, we can anticipate a rather active week in southeastern CO, followed by a quieter week statewide, before ending the month with an extremely active severe weather week. If we coincide these predictions with the drought monitor above that indicates a normal month for precipitation statewide, it’s reasonable to predict that Colorado is going to have a relatively normal June for precipitation (although we all know Colorado’s weather in June is anything but normal).
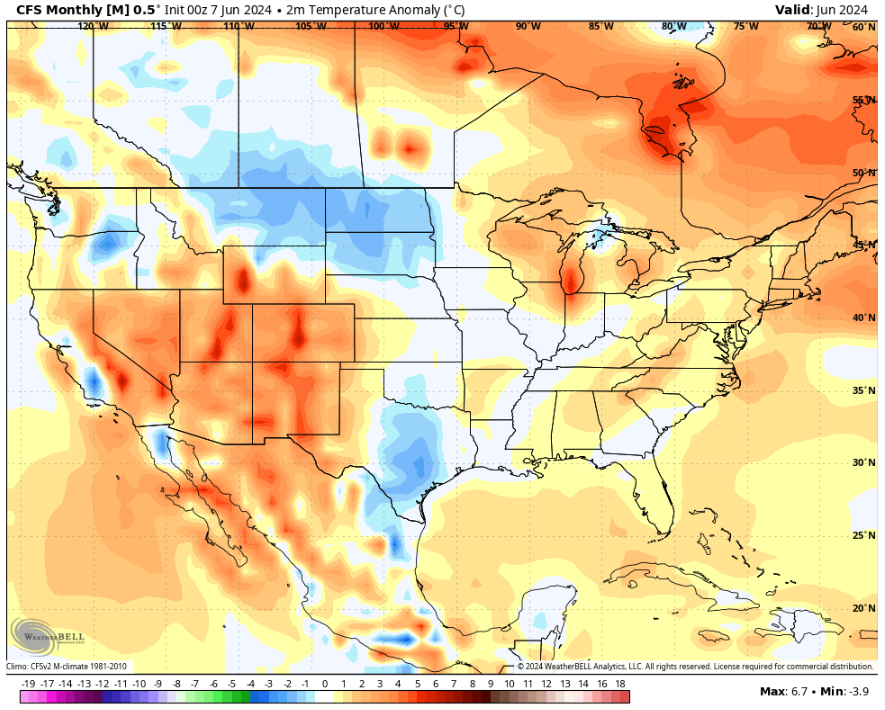
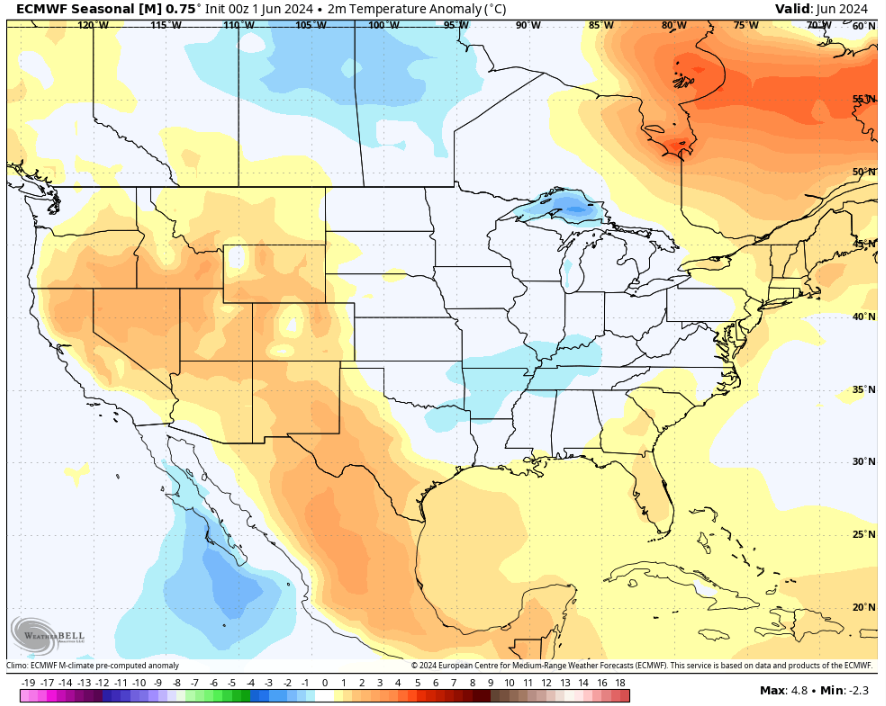
June 5th of this year marked the first day of 2024 that the DIA weather station reached 90°F. 5 days earlier than the average first 90° day of June 10th, June 5th was another precursor of things to come: this June will be hot. Looking at the figures, it’s shown that both the American and European climate models are suggesting that our first month of meteorological summer will be warmer than usual. And while the map-wide discrepancy shown between these two models is indicative of why we take these things with a grain of salt, the agreement between the two models over Colorado is strong enough to claim that this June will be, on average, 2-5°C warmer than usual, which translates to 4-9°F.
June Climatology for Denver
(Normal Period 1991-2020 Dia Data)
Temperature
| Average High | 82.4°F |
| Average Low | 52.3°F |
| Monthly Mean | 67.4°F |
| Days With High 90 Or Above | 8 |
| Days With High 32 Or Below | 0 |
| Days With Low 32 Or Below | 0 |
| Days With Lows Zero Or Below | 0 |
Precipitation
| Monthly Mean | 1.98” |
| Days With Measurable Precipitation | 8 |
| Average Snowfall In Inches | 0.0” |
| Days With 1.0 Inch Of Snow Or More | 0 |
Miscellaneous Averages
| Heating Degree Days | 133 |
| Cooling Degree Days | 62 |
| Wind Speed (Mph) | 8.9 mph |
| Wind Direction | South |
| Days With Thunderstorms | 10 |
| Days With Dense Fog | <1 |
| Percent Of Sunshine Possible | 70% |
Extremes
| Record High | 105 on 6/25/2012, 6/26/2012 |
| Record Low | 30 on 6/2/1951 |
| Warmest | 75.0 in 2012 |
| Coldest | 60.6 in 1967 |
| Wettest | 4.96” in 1882 |
| Driest | TR in 1890 |
| Snowiest | 0.5” in 1953 |
| Least Snowy | 0.0” in numerous years |
2024 Rainfall Accumulation for the Colorado Eastern Plains
| City | May | June | July | Aug | Sept | Total |
| Aurora (Central) | 1.17 | 1.17 | ||||
| Boulder | 0.26 | 0.26 | ||||
| Brighton | 0.57 | 0.57 | ||||
| Broomfield | 0.77 | 0.77 | ||||
| Castle Rock | 1.59 | 1.59 | ||||
| Colo Sprgs Airport | 0.82 | 0.82 | ||||
| Denver DIA | 1.7 | 1.7 | ||||
| Denver Downtown | 1.21 | 1.21 | ||||
| Golden | 0.98 | 0.98 | ||||
| Fort Collins | 0.93 | 0.93 | ||||
| Highlands Ranch | 1.81 | 1.81 | ||||
| Lakewood | 1.03 | 1.03 | ||||
| Littleton | 1.39 | 1.39 | ||||
| Monument | 1.79 | 1.79 | ||||
| Parker | 1.63 | 1.63 | ||||
| Sedalia – Hwy 67 | 1.94 | 1.94 | ||||
| Thornton | 0.37 | 0.37 | ||||
| Westminster | 0.65 | 0.65 | ||||
| Wheat Ridge | 0.75 | 0.75 | ||||
| Windsor | 0.94 | 0.94 |
The Skyview Weather Newsletter is a monthly publication that aims to provide readers with engaging and informative content about meteorological science. Each issue features articles thoughtfully composed by Skyview’s team of meteorologists, covering a wide range of topics from the birth of Doppler Radar to the impact of weather phenomena. The newsletter serves as a platform to share the latest advancements in weather forecasting technology and the science behind it, enhancing our understanding of weather.
Skyview Weather has been a pillar for reliable weather services for over 30 years, providing unparalleled forecasts and operations across the Continental US. We offer a comprehensive suite of services that range from live weather support to detailed forecasts, extensive weather data collection, and weather reporting. Our clients, ranging from concert venues to golf courses, theme parks to hotels, schools to police departments, and more, rely on Skyview Weather for winter and summer weather alerts, now available on the Skyview Weather mobile app. These alerts cover a broad spectrum of weather conditions, including snow, lightning, hail, tornadoes, severe weather, and heavy rain. Learn more about how Skyview Weather products and services can support your organization through severe, winter, flood, and fire weather.