April 2024 Skyview Weather Monthly Newsletter
Feature Article
Unveiling the 2024 Solar Eclipse: Cloud Cover Outlook, Scientific Insights, and Weather Hazards
Introduction
In the expansive realm of celestial mechanics, where gravitational forces orchestrate the movements of celestial bodies, the universe is preparing for a remarkable event: a total solar eclipse poised to offer a unique glimpse into the workings of our solar system. Occurring on Monday, April 8, 2024, this event will unfold across select regions of North America, showcasing a rare alignment of the Sun, Moon, and Earth.
The Astronomical Alignment: An Intricate Dance of Celestial Bodies
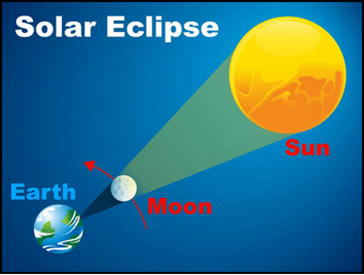
A solar eclipse occurs when the Moon, in its orbit around Earth, passes between the Sun and our planet, obstructing the solar disk from view. This alignment happens when the Moon’s orbital plane intersects with the ecliptic plane—the apparent path of the Sun across the celestial sphere—resulting in a momentary overlap of these celestial bodies.
The Path of Totality: Geographical Significance
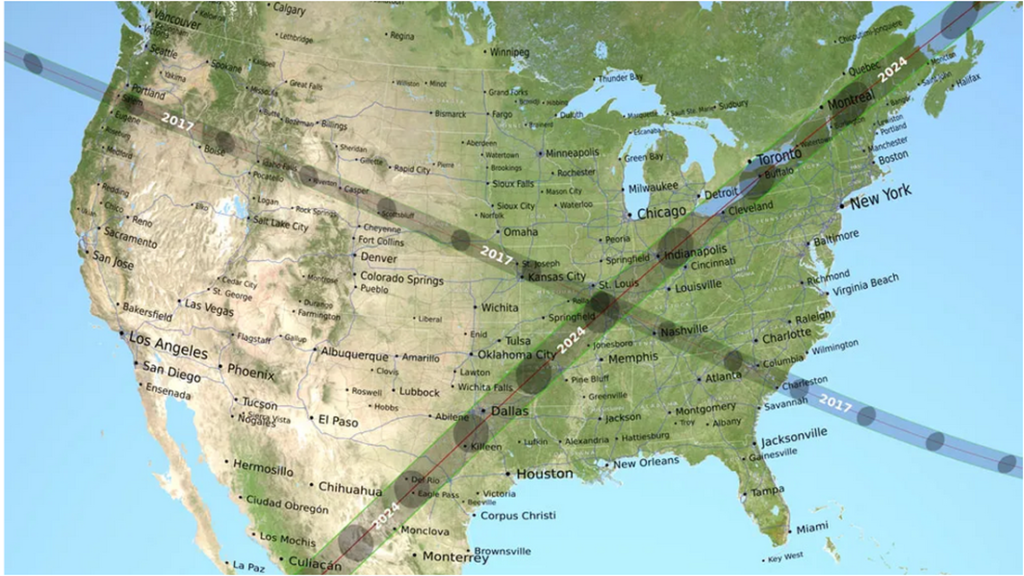
The trajectory of totality, where the Sun will be completely obscured by the Moon, follows a distinct path across Earth’s surface. Commencing in Texas, USA, the path extends northeastward, traversing portions of the Mississippi and Ohio Valleys before culminating in New York State.
Scientific Insights: Eclipse Classification
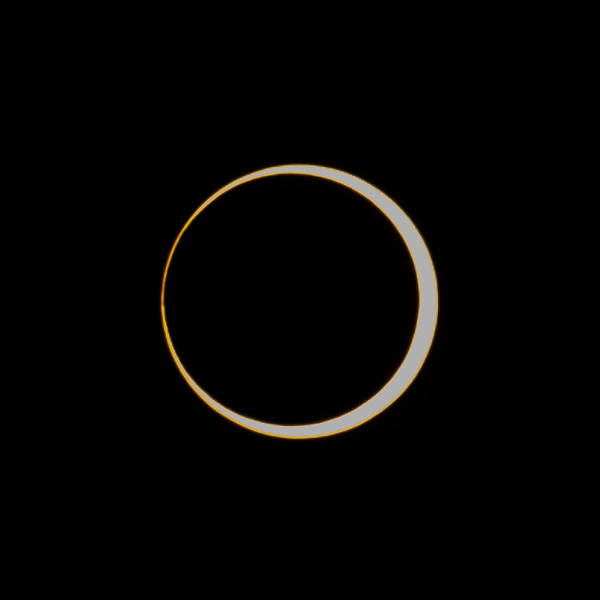
Solar eclipses are categorized based on the extent of coverage observed from a specific vantage point. A partial eclipse occurs when only a portion of the solar disk is obscured by the Moon’s shadow, resulting in a gradual dimming of sunlight. Conversely, a total solar eclipse happens when the Moon fully obscures the Sun, plunging the immediate vicinity into darkness and revealing the solar corona—the Sun’s outer atmosphere—with breathtaking clarity.
Observational Considerations: Safety, Meteorological Factors, and Hazards
While witnessing a solar eclipse is awe-inspiring, it’s crucial to prioritize safety precautions. Direct viewing of the Sun without proper eye protection can cause permanent retinal damage. Utilizing certified solar filters or indirect viewing methods, such as pinhole projectors, ensures safe observation of this celestial phenomenon.
Meteorological conditions also significantly impact eclipse visibility. Clear skies are essential for optimal viewing, enabling spectators to witness the intricate details of the solar corona. However, it’s increasingly likely that much of the path will be covered by cloudy skies during totality. Cloud cover is expected along the path of totality from Texas through southern Arkansas, with the possibility of obstruction extending to portions of Ohio, northwest Pennsylvania, and far western New York. Conversely, northern New England, Upstate New York, and regions from southern Missouri into central Indiana offer the best chances for clear viewing.
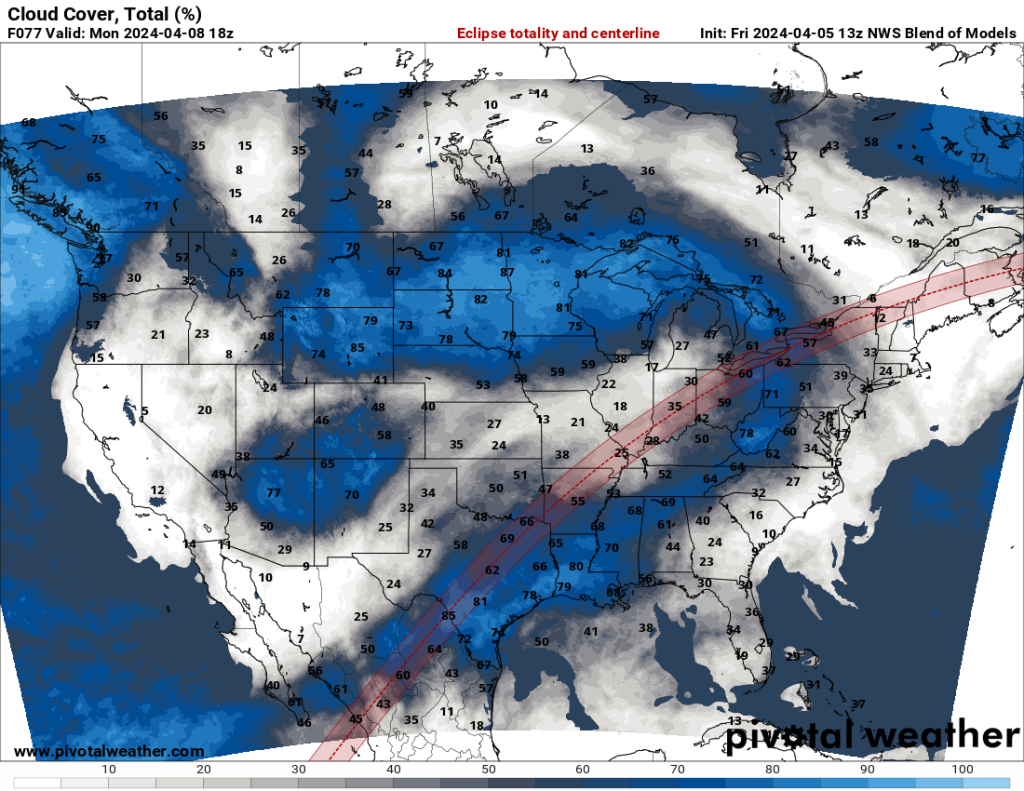
In Dallas, Texas (where most of us Coloradans will drive to since it is the closest spot to view the spectacle), the forecast for Eclipse Day continues to predict partly to mostly cloudy conditions. Widespread upper cloud cover is expected (>90% chance). Dense low clouds near the Gulf Coast are projected to move north during the day, potentially obstructing the eclipse for parts of the region. However, the extent to which these clouds will advance northward remains uncertain. Optimal viewing conditions for Texas are unlikely due to anticipated cloud cover for many areas. Confidence is high that high clouds will be present (greater than 90 percent chance) in areas in the South and Midwest. The forecast for low, however, is more uncertain, with the likelihood of these clouds in Texas being most prominent across the Brazos Valley and Central Texas, though exact locations are less certain.
In addition to cloud cover, significant weather hazards may pose challenges for eclipse observers. On Monday, an upper-level low is predicted to migrate into the Desert Southwest, coinciding with the establishment of mid-level flow across the south-central U.S. A moist airmass is expected to prevail across the eastern two-thirds of Texas, extending eastward into the lower Mississippi Valley. Model forecasts indicate the likelihood of a significant cluster of thunderstorms developing from northeast Texas into Louisiana and southern Arkansas on Monday evening. The atmospheric conditions suggest that instability and deep-layer shear will likely contribute to a severe weather threat in these regions. Eclipse observers must stay informed about local weather updates and exercise caution as severe weather conditions may impact visibility and safety during the eclipse.
Scientific Inquiry: Research Opportunities
Beyond its aesthetic appeal, a solar eclipse presents unparalleled research opportunities for scientists across various disciplines. Studying the solar corona during totality elucidates phenomena such as solar prominence, coronal mass ejections, and magnetic field dynamics, providing insights into the Sun’s complex behavior. Additionally, ground-based observations combined with satellite imagery facilitate investigations into Earth’s atmospheric response to sudden changes in solar radiance—a phenomenon known as the eclipse-induced atmospheric response. The 2024 solar eclipse underscores the precision of celestial mechanics and offers a platform for scientific inquiry into the dynamics of our solar system. By adhering to rigorous safety protocols and employing advanced observational techniques, spectators can engage in a scientifically enriching experience while marveling at the celestial ballet unfolding overhead.
April Drought Update
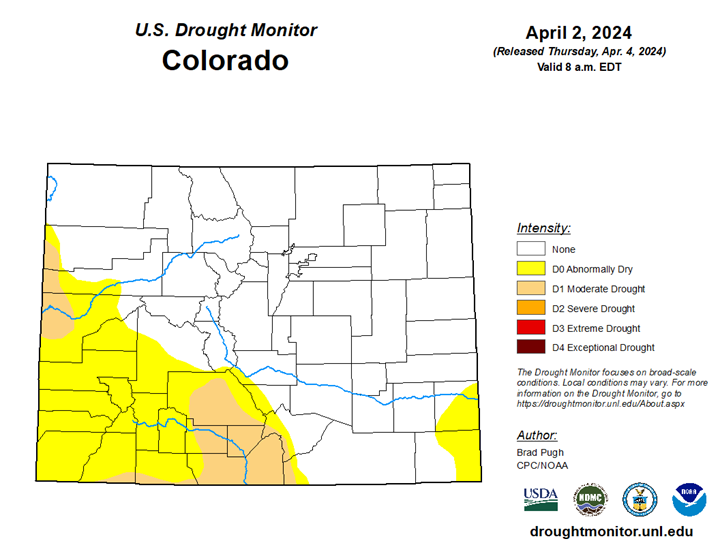
Many of the drought stricken areas have seen improvement across the state through March. The dry sections over the northern Park Range have entirely disappeared, and some improvements in the San Luis Valley have brought their drought down from severe to moderate from several great snowfall events. Most of southwest Colorado hasn’t changed, staying abnormally dry. Areas around Dinosaur National Monument have dried to being abnormally dry, as well as areas of Baca and Prowers counties in the very southeast of Colorado.
April 2024 Temperature Anomaly Forecast
Temperatures are projected to be seasonal for the month of April, with many areas of the country seeing above average temperatures. Above average temperatures will be around the Mississippi River Valley, New England, and the Pacific Northwest, with the highest chance for the Central and Eastern Great Lakes region. No areas see lower than average temperature chances. Temperatures so far have remained seasonal with some days in the low 70s and low dropping to around freezing.
April 2024 Precipitation Anomaly Forecast
Seasonally average precipitation is projected for the month of April, with higher that average chance of the Desert Southwest, Central and Lower Mississippi River Valley, and the greatest chance for the Northern side of the Ohio River Valley.
Colorado March Weather Summary
March 2024 provided slightly below-average temperatures and above average precipitation for the Denver metro area. Denver International Airport (DIA) reported an average daily high temperature of 55.4°F with a daily average low of 27.5°F. Combined, this totaled 41.4°F, 0.2°F below the average monthly temperature of 41.6°F. The warmest day occurred on March 2nd when DIA reached 69°F. The coldest day was March 5th and 25th where temperatures dropped to 15°F.
Boulder Airport reported an average high temperature of 53.1°F and an average low temperature of 31.3°F. Together, the average temperature was 42.2°F. Similarly, the warmest day occurred on the 2nd with 68°F recorded for that day. The coldest day occurred on the 25th and 26th where Boulder dropped to 19°F.
Precipitation-wise, DIA reported 1.65” of liquid precipitation, 0.79” above the average of 0.86” for the month of March. Only a handful of storm systems would impact DIA during March, with 4 storms reporting at least a trace. These events occurred on the 3rd (Trace), 7th-8th (0.3”), 13th-15th (5.7”), and the 24th-25th (3.2”) which would account for the 9.2” total snowfall at DIA for the month.
However, the 13th-15th event would be skewed as minimal snowfall fell for areas around DIA with a record breaking 0.80” of liquid precipitation recorded on the 13th with only a trace of snow, whereas Douglas County had recorded mostly snowfall resulting in over 2 feet of snow in some locations with 3-5 feet for the foothills during this event. The reason that this storm produced so much snow in along the higher terrain as opposed to DIA was due to several factors including persistent up-slope surface flow, temperatures leading up and during the event which helped limit snowfall amounts below 6,000 ft and elevation with areas above 6,000 ft receiving significantly more impactful snow.
Additionally, the storm occurring on the 24th-25th also ended up a little low on the overall climatology as DIA reported only 3.2” of snow during that event, whereas other Denver Metro locations had between 4.0”-8.0” during that event. This would likely result in even higher overall precipitation totals throughout the Denver Metro as DIA had nearly twice the average precipitation for the month.
The Colorado Springs airport recorded an average daily high temperature of 54.9°F with an average daily low of 29.0°F. Combined, this totaled a monthly average of 42.0°F, 0.9°F above the typical 41.1°F monthly average. The warmest day was on March 31st when the temperature reached 69°F. The coldest day was March 16th when the temperature dropped to 16°F. Precipitation-wise, Colorado Springs Airport reported 1.50” of liquid precipitation, 0.71” above the average of 0.79” for March. Most occurred on the 14th with a record breaking 1.05” of liquid precipitation recorded on that day.
Pueblo was similar, with slightly above-average temperatures and well above-average precipitation for the month of March. Pueblo recorded an average daily high temperature of 60.3°F with an average daily low of 28.5°F. The warmest day was March 31st when the airport reached 76°F. The coldest day was March 9th when the temperature dropped to 16°F. Pueblo had well above-average precipitation, with 1.89” of liquid precipitation recorded, at 1.07” above the average of 0.82” for March. Most of the precipitation occurred between the 14th and 15th with 1.64” falling within those 24 hours.
Only a handful of events occurred over southeastern Colorado, with only 4 notable events recorded for the month. However, some of those storms brought very impactful snow. The first couple of systems were generally weak and occurred on the 2nd-3rd and 7th-8th where some light to moderate snow was over the Colorado Springs area and Pueblo, bringing minimal snowfall overall. The most impactful system moved in on the 13th through 15th bringing record breaking precipitation and widespread heavy snow for portions of southeastern Colorado. Colorado Springs saw between 12.0”-24.0” during this event, whereas Pueblo only received between 2.0”-8.0” during this time. The only other notable event occurred on the 24th through 25th bringing additional snowfall to portions of southeastern Colorado.
Weather Statistics for Denver International Airport, March 2024
DIA March 2024 Temperature (°F)
| Observed Value | Normal Value | Departure From Normal | |
| Average Max | 55.4°F | 55.7°F | -0.3°F |
| Average Min | 27.5°F | 27.5°F | 0°F |
| Monthly Mean | 41.4°F | 41.6°F | -0.2°F |
| Days With Max 90 Or Above | 0 | 0 | 0 |
| Days With Max 32 Or Below | 2 | 1.7 | 0.3 |
| Days With Min 32 Or Below | 22 | 23.2 | -1.2 |
| Days With Min 0 Or Below | 0 | 0.2 | -0.2 |
DIA March 2024 Liquid Precipitation (Inches)
| Observed Value | Date(S) | Normal Value | Departure From Normal | |
| Monthly Total | 1.65” | 0.86” | 0.79” | |
| Yearly Total | 3.39” | 1.65” | 1.74” | |
| Greatest In 24 Hours | 1.23” | 3/13-3/14 | ||
| Days With Measurable Precip. | 8 | 6.4 | 1.6 |
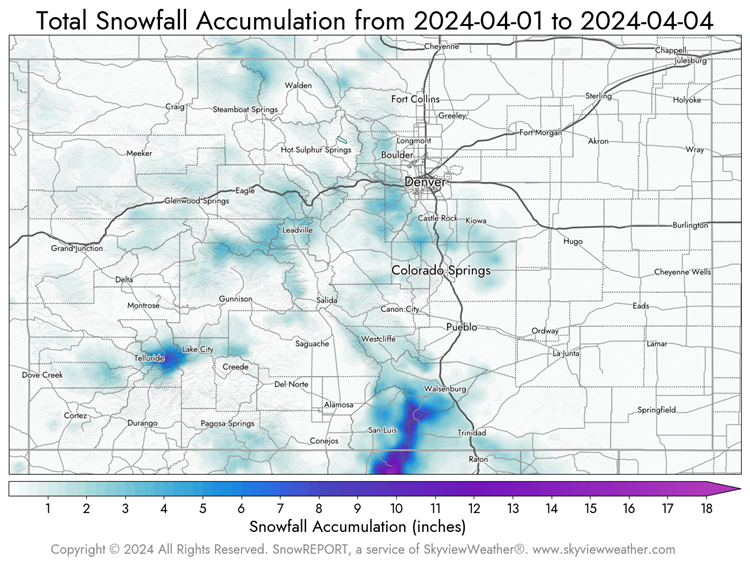
April 2024 Preview
Spring is definitely in the air as we begin to trade snow in for rain. So far, April has presented warm and windy conditions as well as some thunderstorm activity. Very little snow has fallen in comparison to last month. Below is a map of the total snowfall across Colorado so as of 4/4/24 in April. As of 4/4/24, 0.35” of liquid precipitation has fallen at DIA with just a trace of snow.
At this point, we are beginning to see more rain and/or thunderstorms rather than large snowstorms. This does not mean that snow is out of the cards, as Colorado has had snowstorms in May in previous years. However, the focus for weather patterns is beginning to shift towards thunderstorm activity and lightning risk.
Denver’s Monthly Temperature, Rainfall, And Snowfall Extremes For April (1872-Present)
Top 20 Warmest April’s
| Rank | Avg | Year |
| 1 | 56.4 | 1981 |
| 2 | 56.3 | 1946 |
| 3 | 55.5 | 1930 |
| 4 | 55.3 | 1943 |
| 5 | 54.8 | 1992 |
| 6 | 53.8 | 1881 |
| 7 | 53.6 | 1954 |
| 8 | 53.3 | 2012 |
| 9 | 53.3 | 1888 |
| 10 | 53.2 | 1948 |
| 11 | 52.8 | 1925 |
| 12 | 52.2 | 1969 |
| 13 | 52.2 | 1910 |
| 14 | 51.8 | 1987 |
| 15 | 51.5 | 2006 |
| 16 | 51.5 | 1942 |
| 17 | 51.5 | 1915 |
| 18 | 51.4 | 1934 |
| 19 | 51.2 | 1965 |
| 20 | 51.2 | 1932 |
Top 20 Wettest April’s
| Rank | Total | Year |
| 1 | 8.24 | 1900 |
| 2 | 5.86 | 1999 |
| 3 | 4.95 | 1905 |
| 4 | 4.94 | 1885 |
| 5 | 4.13 | 1957 |
| 6 | 4.09 | 1933 |
| 7 | 4.07 | 1935 |
| 8 | 4.01 | 1942 |
| 9 | 3.95 | 1967 |
| 10 | 3.75 | 1914 |
| 11 | 3.73 | 1973 |
| 12 | 3.67 | 1906 |
| 13 | 3.66 | 1915 |
| 14 | 3.65 | 1922 |
| 15 | 3.52 | 1972 |
| 16 | 3.33 | 1884 |
| 17 | 3.3 | 1894 |
| 18 | 3.22 | 2009 |
| 19 | 3.15 | 1944 |
| 20 | 3.1 | 1883 |
Top 20 Snowiest April’s
| Rank | Total | Year |
| 1 | 33.8 | 1933 |
| 2 | 32 | 1885 |
| 3 | 28.3 | 1920 |
| 4 | 28.2 | 1945 |
| 5 | 25.5 | 1957 |
| 6 | 25.4 | 1909 |
| 7 | 25 | 1907 |
| 8 | 24.8 | 1973 |
| 9 | 23.3 | 1935 |
| 10 | 21 | 1922 |
| 11 | 20.4 | 2013 |
| 12 | 19.7 | 1999 |
| 13 | 19.6 | 1900 |
| 14 | 19.5 | 1944 |
| 15 | 19.5 | 1918 |
| 16 | 18 | 1884 |
| 17 | 17.8 | 1974 |
| 18 | 17.6 | 1959 |
| 19 | 17.2 | 1995 |
| 20 | 17.2 | 1972 |
Top 20 Coldest April’s
| Rank | Avg | Year |
| 1 | 38.8 | 1920 |
| 2 | 40.5 | 1997 |
| 3 | 41 | 1983 |
| 4 | 41.1 | 1873 |
| 5 | 41.4 | 1957 |
| 6 | 41.7 | 2013 |
| 7 | 42.2 | 1945 |
| 8 | 42.3 | 1984 |
| 9 | 42.5 | 1999 |
| 10 | 42.6 | 1918 |
| 11 | 42.8 | 1953 |
| 12 | 42.9 | 1995 |
| 13 | 42.9 | 1968 |
| 14 | 42.9 | 1884 |
| 15 | 43.2 | 1973 |
| 16 | 43.2 | 1944 |
| 17 | 43.2 | 1909 |
| 18 | 43.2 | 1874 |
| 19 | 43.7 | 1970 |
| 20 | 43.8 | 1951 |
Top 20 Driest April’s
| Rank | Total | Year |
| 1 | 0.03 | 1963 |
| 2 | 0.05 | 1878 |
| 3 | 0.06 | 2022 |
| 4 | 0.23 | 2002 |
| 5 | 0.31 | 1880 |
| 6 | 0.32 | 2008 |
| 7 | 0.33 | 1996 |
| 8 | 0.34 | 1982 |
| 9 | 0.39 | 1908 |
| 10 | 0.4 | 1925 |
| 11 | 0.48 | 1955 |
| 12 | 0.5 | 1881 |
| 13 | 0.53 | 1992 |
| 14 | 0.54 | 2020 |
| 15 | 0.6 | 1930 |
| 16 | 0.6 | 1923 |
| 17 | 0.6 | 1902 |
| 18 | 0.65 | 1988 |
| 19 | 0.67 | 2006 |
| 20 | 0.71 | 2000 |
Top 20 Least Snowiest April’s
| Rank | Total | Year |
| 1 | 0 | 1992 |
| 2 | 0 | 1943 |
| 3 | 0 | 1930 |
| 4 | T | 2022 |
| 5 | T | 2002 |
| 6 | T | 1969 |
| 7 | T | 1946 |
| 8 | T | 1925 |
| 9 | T | 1915 |
| 10 | T | 1910 |
| 11 | T | 1889 |
| 12 | T | 1888 |
| 13 | T | 1887 |
| 14 | 0.2 | 1963 |
| 15 | 0.3 | 2006 |
| 16 | 0.3 | 1965 |
| 17 | 0.5 | 2010 |
| 18 | 0.5 | 1896 |
| 19 | 0.8 | 1985 |
| 20 | 0.9 | 2007 |
April Climatology for Denver
(Normal Period 1991-2020 Dia Data)
Temperature
| Temperature | Observed Value |
| Average High | 61.7°F |
| Average Low | 33.9°F |
| Monthly Mean | 47.8°F |
| Days With High 90 Or Above | 0 |
| Days With High 32 Or Below | 0.5 |
| Days With Low 32 Or Below | 13.2 |
| Days With Lows Zero Or Below | 0 |
Precipitation
| Precipitation | Observed Value |
| Monthly Mean | 1.68” |
| Days With Measurable Precipitation | 9 |
| Average Snowfall In Inches | 6.1” |
| Days With 1.0 Inch Of Snow Or More | NA |
Miscellaneous Averages
| Heating Degree Days | 517 |
| Cooling Degree Days | 1 |
| Wind Speed (Mph) | 10.0 mph |
| Wind Direction | South |
| Days With Thunderstorms | 2 |
| Days With Dense Fog | 1 |
| Percent Of Sunshine Possible | 67% |
Extremes
| Record High | 90 on 4/30/1992 |
| Record Low | -2 on 4/2/1975 |
| Warmest | 56.4 in 1946, 1981 |
| Coldest | 38.8 in 1920 |
| Wettest | 8.42” in 1900 |
| Driest | 0.03” in 1963 |
| Snowiest | 33.8” in 1933 |
| Least Snowy | 0.0” in 1882, 1930, 1943, 1995 |
Winter 2023/2024 Snowfall Accumulation for the Colorado Eastern Plains
| City | Oct | Nov | Dec | Jan | Feb | Mar | Apr | Total |
| Aurora | 6.6 | 2.3 | 10.4 | 3.9 | 11.6 | 17.5 | 52.3 | |
| Boulder | 5 | 7.8 | 9.2 | 8.5 | 13.9 | 19.1 | 63.5 | |
| Brighton | 4.7 | 4 | 1.1 | 2.2 | 7.8 | 8.8 | 28.6 | |
| Broomfield | 4.3 | 5.3 | 3.2 | 5.1 | 13.9 | 22.3 | 54.1 | |
| Castle Rock | 9 | 2.1 | 9.7 | 12.1 | 17.4 | 31.1 | 81.4 | |
| Colorado Springs Airport | 0 | 1.1 | 8.4 | 5.1 | 11.5 | 13.3 | 39.4 | |
| Denver DIA | 7.5 | 2.9 | 1.4 | 4.2 | 13.7 | 9.2 | 38.9 | |
| Denver Downtown | 5.3 | 2.1 | 6.2 | 4.6 | 10.9 | 12.1 | 41.2 | |
| Golden | 10.7 | 14 | 14.6 | 13.2 | 37.7 | 54.7 | 144.9 | |
| Fort Collins | 5.7 | 9.6 | 0 | 3.3 | 5.7 | 11.1 | 35.4 | |
| Highlands Ranch | 5.8 | 1.8 | 6.9 | 5.1 | 11.6 | 20.2 | 51.4 | |
| Lakewood | 8.6 | 4.1 | 11.3 | 5.5 | 21.3 | 23 | 73.8 | |
| Littleton | 10 | 1.6 | 6 | 3.7 | 12.3 | 14.3 | 47.9 | |
| Monument | 6.5 | 1.5 | 14.8 | 14.1 | 20.3 | 25.2 | 82.4 | |
| Parker | 7.4 | 1 | 8.8 | 9.1 | 12.3 | 27.1 | 65.7 | |
| Sedalia – Hwy 67 | 10.5 | 3.3 | 9.4 | 12.8 | 20 | 35.6 | 91.6 | |
| Thornton | 4 | 4.4 | 4.4 | 4.4 | 12.8 | 12.5 | 42.5 | |
| Westminster | 5.1 | 4.7 | 5.3 | 4.8 | 13.7 | 20 | 53.6 | |
| Wheat Ridge | 6 | 3.4 | 6.9 | 5.3 | 22.1 | 22.6 | 66.3 | |
| Windsor | 3.5 | 5.5 | TR | 4.9 | 9 | 11 | 33.9 |
The Skyview Weather Newsletter is a monthly publication that aims to provide readers with engaging and informative content about meteorological science. Each issue features articles thoughtfully composed by Skyview’s team of meteorologists, covering a wide range of topics from the birth of Doppler Radar to the impact of weather phenomena. The newsletter serves as a platform to share the latest advancements in weather forecasting technology and the science behind it, enhancing our understanding of weather.
Skyview Weather has been a pillar for reliable weather services for over 30 years, providing unparalleled forecasts and operations across the Continental US. We offer a comprehensive suite of services that range from live weather support to detailed forecasts, extensive weather data collection, and weather reporting. Our clients, ranging from concert venues to golf courses, theme parks to hotels, schools to police departments, and more, rely on Skyview Weather for winter and summer weather alerts, now available on the Skyview Weather mobile app. These alerts cover a broad spectrum of weather conditions, including snow, lightning, hail, tornadoes, severe weather, and heavy rain. Learn more about how Skyview Weather products and services can support your organization through severe, winter, flood, and fire weather.