Labor Day in Denver, Colorado, serves as a vibrant marker of summer’s end and the approach of fall. Historically, this holiday has showcased a wide range of weather extremes, from scorching heatwaves to cooler autumnal chill. As September 1st, the first day of meteorological fall, approaches, it’s a great time to reflect on Denver’s weather extremes and anticipate what’s to come this year.
Labor Day Weather Extremes in Denver
Labor Day has seen Denver experience some of its most extreme weather. The highest recorded temperature on this holiday was a sweltering 100°F on September 2, 2019, while the coldest was a chilly 40°F on September 3, 1973, September 4, 1961, and September 3, 1934. The average high temperature on Labor Day is about 82.7°F, with lows around 53.8°F.
In terms of precipitation, Denver has seen variability as well. The wettest Labor Day was on September 1, 1997, with 0.44 inches of rain, while many years have recorded no precipitation at all. Notably, Labor Day in Denver has never seen snow, reflecting the typically warm and dry conditions of this holiday.
| Top 10 Warmest Labor Day’s | Top 10 Warmest Min Labor Day’s | |||||
| (1894-Present) | (1894-Present) | |||||
| Rank | High | Year | Rank | Low | Year | |
| 1 | 100 | 09-02-2019 | 1 | 66 | 09-02-2019 | |
| 2 | 97 | 09-05-2022 | 2 | 65 | 09-05-2022 | |
| 97 | 09-04-1995 | 65 | 09-03-1945 | |||
| 4 | 94 | 09-06-2021 | 4 | 64 | 09-04-1995 | |
| 94 | 09-04-2017 | 5 | 63 | 09-07-1931 | ||
| 94 | 09-04-1978 | 63 | 09-02-1929 | |||
| 94 | 09-05-1960 | 63 | 09-04-1922 | |||
| 94 | 09-07-1959 | 63 | 09-01-1919 | |||
| 9 | 93 | 09-04-2023 | 9 | 62 | 09-01-1947 | |
| 93 | 09-07-2020 | 62 | 09-03-1917 | |||
| 93 | 09-05-2016 | |||||
| 93 | 09-03-1990 | |||||
| 93 | 09-03-1945 | |||||
| 93 | 09-04-1899 | |||||
| Top 10 Coldest Labor Day’s | Top 10 Lowest Max Labor Day’s | |||||
| (1894-Present) | (1894-Present) | |||||
| Rank | Low | Year | Rank | High | Year | |
| 1 | 40 | 09-03-1973 | 1 | 52 | 09-02-1974 | |
| 40 | 09-04-1961 | 2 | 53 | 09-04-1961 | ||
| 40 | 09-03-1934 | 3 | 59 | 09-01-1952 | ||
| 4 | 42 | 09-06-1943 | 4 | 60 | 09-06-1909 | |
| 42 | 09-02-1974 | 5 | 66 | 09-04-1905 | ||
| 6 | 43 | 09-07-2020 | 6 | 67 | 09-03-1956 | |
| 43 | 09-04-2006 | 67 | 09-01-1930 | |||
| 43 | 09-06-1965 | 67 | 09-02-1918 | |||
| 9 | 44 | 09-06-2004 | 9 | 68 | 09-07-1987 | |
| 44 | 09-07-1970 | 10 | 71 | 09-03-1962 | ||
| Top 10 Wettest Labor Day’s | Top 10 Snowiest Labor Day’s | |||||
| (1894-Present) | (1894-Present) | |||||
| Rank | Total | Year | Rank | Total | Year | |
| 1 | 0.44 | 09-01-1997 | No Snow Recorded on Labor Day | |||
| 2 | 0.41 | 09-02-1918 | ||||
| 3 | 0.31 | 09-02-1974 | ||||
| 4 | 0.26 | 09-06-1909 | ||||
| 5 | 0.25 | 09-04-1961 | ||||
| 6 | 0.18 | 09-01-1941 | ||||
| 7 | 0.15 | 09-07-2020 | ||||
| 8 | 0.1 | 09-02-1929 | ||||
| 9 | 0.07 | 09-07-1903 | ||||
| 10 | 0.03 | 09-04-2000 | ||||
| Top 10 Driest Labor Day’s | Top 10 Least Snowiest Labor Day’s | |||||
| (1894-Present) | (1894-Present) | |||||
| Rank | Low | Year | Rank | Total | Year | |
| Numerous Years with “0” | No Snow Recorded on Labor Day | |||||
TEMPERATURES: WARMEST: (100) 2019, COLDEST: (40) 1973,1961,1934
AVERAGE TEMPERATURES: HIGH (82.7), LOW (53.8)
PRECIPITATION: WETTEST: (0.44″) 1997
HISTORICAL CHANCE OF PRECIPITATION: 11%
Courtesy of NOAA/NWS
September 2024 Outlook
As we transition into meteorological fall on September 1, 2024, it’s a time to celebrate the arrival of cooler weather and the beauty of the changing season. This marks the beginning of a new chapter, filled with crisp air and vibrant foliage.
El Niño Southern Oscillation (ENSO) Conditions: Currently, ENSO conditions are neutral, with equatorial sea surface temperatures (SSTs) above average in the western Pacific, near average in the east-central Pacific, and below average in the eastern Pacific. La Niña is favored to develop during September-October-November (66% chance) and is expected to persist through the winter of 2024-2025 (near 70% chance).
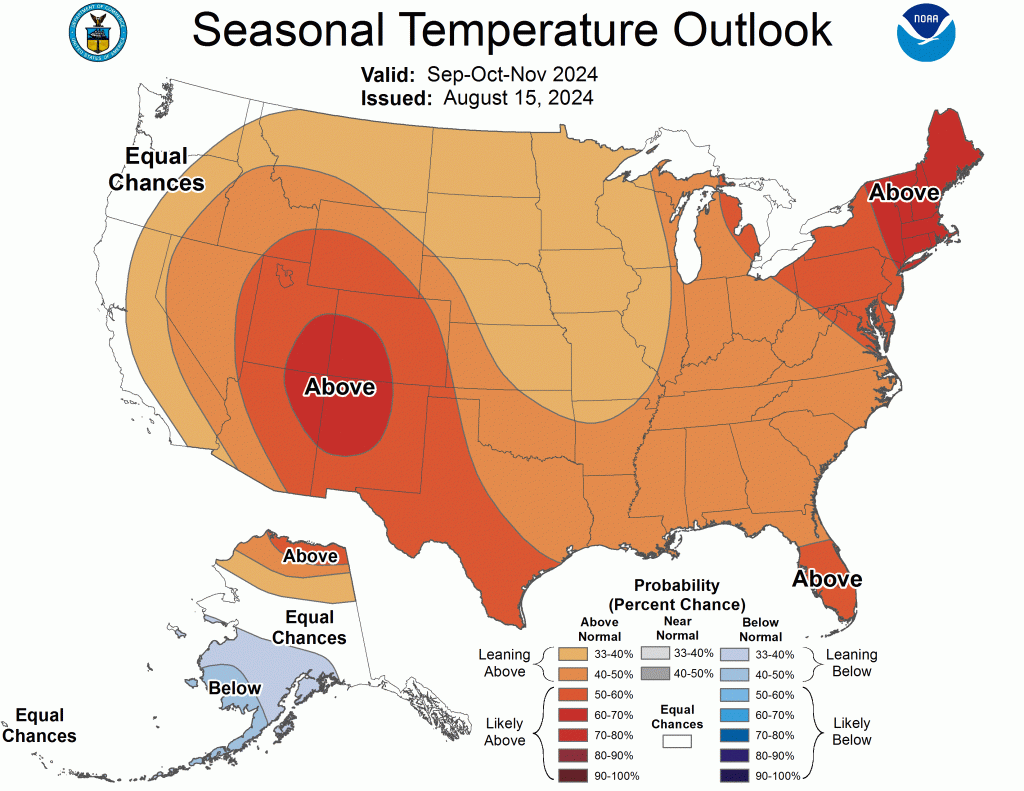
Temperature Outlook: The September-October-November (SON) 2024 temperature outlook favors above-normal temperatures across a majority of the contiguous U.S. According to NOAA, the largest probabilities (exceeding 60%) for above-normal temperatures are forecast for New England and parts of the Southwest. Elevated probabilities for below-normal temperatures are expected for southwestern Alaska, while above-normal temperatures are more likely across northern Alaska.
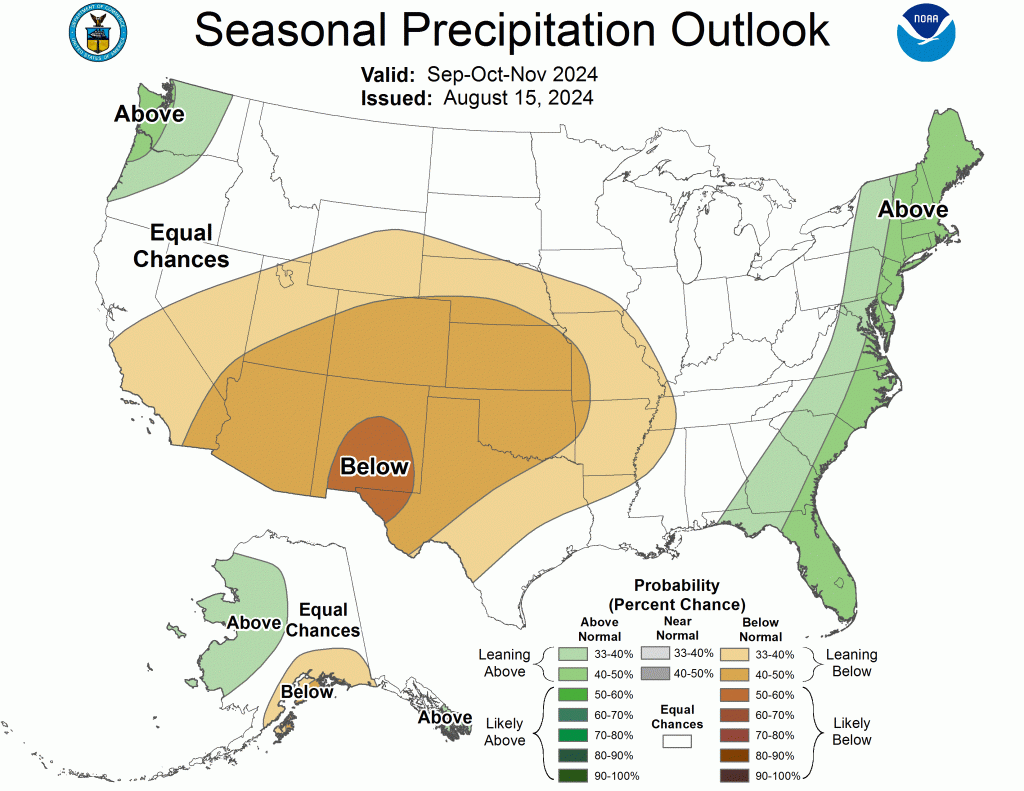
Precipitation Outlook: The SON 2024 precipitation outlook shows elevated probabilities for above-normal precipitation along the East Coast, parts of the Pacific Northwest, and western Alaska. Conversely, below-normal precipitation is favored for the Central to Southern Great Plains, Central Rockies, Southwest, southern California, and southern Alaska. Areas depicted as “Equal-Chances” (EC) indicate regions where climate signals are weak, meaning there are equal chances for above-, near-, or below-normal seasonal mean temperatures or total precipitation amounts.
Current Atmospheric and Oceanic Conditions
Currently, Equatorial SSTs are higher than the typical average in the western Pacific, close to average in the east-central Pacific, and below average in the eastern Pacific. Observed SST anomalies in the Niño 3.4 region are around 0.0 degrees Celsius. Subsurface temperature anomalies are near -1.0 degrees Celsius, indicating a decrease from early July. The Madden-Julian Oscillation (MJO) has strengthened, and its forecast suggests a favorable environment for tropical cyclone development in the Atlantic basin through early September.
Prognostic Discussion
Temperature: Above-normal temperatures are favored across much of the contiguous U.S. during SON 2024. Probabilities exceed 60% in New England and parts of the Southwest. For southwestern Alaska and the Aleutians, below-normal temperatures are more likely. The influence of La Niña is expected to increase, particularly in the winter months, affecting temperature patterns.
Precipitation: The precipitation outlook indicates below-normal precipitation for the Central to Southern Great Plains, Southwest, and southern California. Above-normal precipitation is anticipated for the East Coast, Pacific Northwest, and western Alaska. La Niña composites will play a significant role in shaping these patterns as the fall progresses.
In Summary
Labor Day in Denver is a reminder of the city’s diverse weather history, from extreme heat to mild autumn chills. As September unfolds and meteorological fall begins, Denverites can expect a likely continuation of warm temperatures with drier conditions. The transition to fall offers a refreshing shift and an opportunity to enjoy the seasonal changes. Celebrate the start of meteorological fall and embrace the beauty of autumn in the Rockies!